Introduction
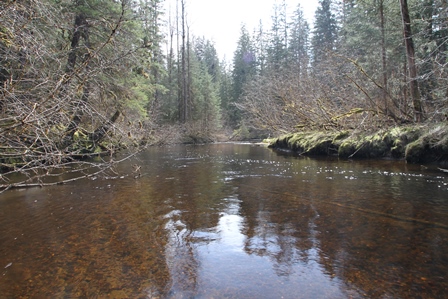
- Since 2010, the Southeast Alaska Network has been monitoring the health of the Salmon, Taiya, and Indian Rivers.
- Measuring water quality over long time periods can tell us how a changing climate and evolving landscape affect national park watersheds, but sometimes we also detect immediate problems.
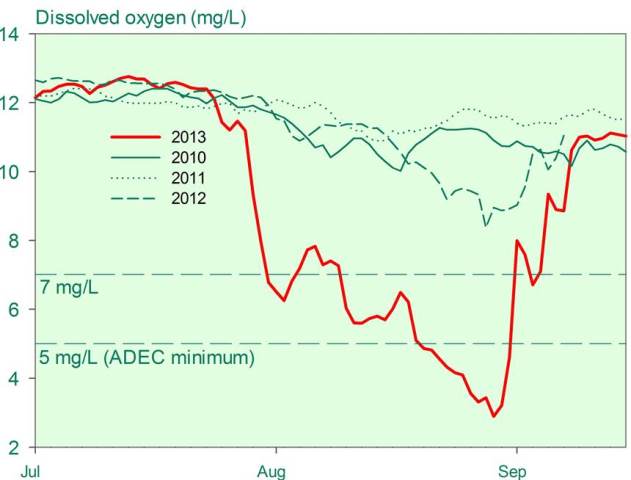
- During August 2013, a combination of warmer than average water temperature, low streamflow, and high abundance of spawning salmon created low dissolved oxygen conditions in the Indian River.
Importance and Status

NPS
The Southeast Alaska Inventory & Monitoring Network (SEAN) has been monitoring water quality for five years in the Salmon River (Glacier Bay), Taiya River (Klondike Gold Rush), and Indian River (Sitka). To measure water quality, hourly measurements of water temperature, specific conductance, dissolved oxygen, and pH are collected from mid-April through mid-November. To detect glacial runoff, the SEAN collects turbidity data from the Taiya River, a watershed covered in approximately one-third ice.
The majority of data suggest that no considerable sources of pollution are affecting the health of these rivers. However, in August 2013, a combination of warmer than average air and water temperatures, low streamflow volume, and high abundance of spawning salmon created temporary hazardous conditions for aquatic life in the Indian River (see figure). During this 3-week period, Dolly Varden and cutthroat trout were found dead, assumedly due to low oxygen conditions. While this type of low oxygen event has only been observed once in five years, continued monitoring will help determine how often these events occur.
National parks can use water quality monitoring data to assess long-term changes to watersheds because of a changing climate and dynamic landscape. In the near-term, water quality monitoring describes the current natural quality of wilderness and assesses whether state or federal water quality lands have been exceeded. These data may also serve an important purpose outside of national parks by defining reference conditions for comparison with developed lands.

NPS
This figure shows annual summertime dissolved oxygen trends for the Indian River. Note the steep decline during late August 2013 (red line), where levels reached a minimum of 1.7 milligrams per liter (mg/L). The Alaska Department of Environmental Conservation (ADEC) water quality standards state that dissolved oxygen should remain above 7 mg/L for waters with fish, while waters without fish should remain above 5 mg/L.
For More Information
Reports and Data Access: https://science.nature.nps.gov/im/units/sean/FQ_main.aspx
Data provided in this article was updated on September 2015.
Last updated: October 21, 2015
