Last updated: August 25, 2017
Article
Melting the rocky terminus of Emmons Glacier

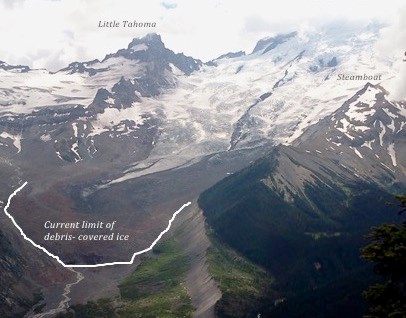
Most views of Mount Rainier from the Sunrise area are dominated – at least in part – by Emmons Glacier, the largest glacier in the United States outside of Alaska. Like the other large glaciers on Rainier’s north slope (Carbon Glacier and Winthrop Glacier), the front end, or terminus, of Emmons glacier is covered in rock debris. Some of this rock debris comes from periodic rock falls from the neighboring ridges, while other debris is scraped from rock ridges that the glacier flows over. Regardless of the source, melting concentrates the debris at the glacier surface as the ice flows downslope, resulting in a nearly-continuous debris-cover over the lower half-mile of the glacier (see Figure 1 below). This phenomenon is not unique to Mount Rainier, but is becoming more widespread in mountainous areas where glaciers are thinning.
This “supraglacial” rock debris has important and complex impacts on the response of glaciers to climate changes. Whereas snow and ice keep cool by reflecting much of the incoming sunshine back into the atmosphere, rock debris absorbs most of the incoming radiation. As the rock blanket heats up, it conducts some of that heat to the ice to allow melting to proceed. But if the debris is more than a few inches thick, the debris acts like a blanket that slows melting overall. So the thickness and “conductivity” of the debris cover determine whether the debris hastens or hinders melt of the underlying glacier, and this has huge implications in parts of the world where glacier meltwater is an important freshwater resource.
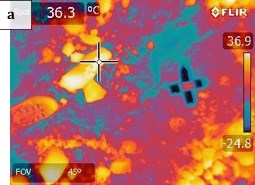
Our work on Emmons Glacier, spanning July 2013 to August 2014, has been aimed at testing a method of remotely estimating debris thickness and conductivity over large areas of debris-covered glaciers. The method involves use of airborne thermal infrared (TIR) imaging systems, which can be used to efficiently capture debris-surface temperature over large areas. We have tested part of the method on Emmons Glacier by measuring surface temperature in four different ways – including with a handheld TIR camera – and simultaneously monitoring the ablation (melting) occurring beneath the debris in a small study area. Figure 2a shows a sample TIR heat-image of a study plot where ~6 inches of gravelly sand covers the ice.
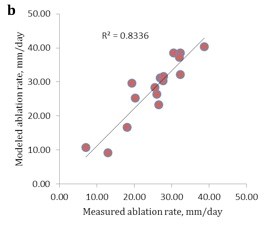
By balancing the incoming and outgoing energy as constrained by our measured surface temperatures, we estimated the “thermal resistance” (which accounts for both debris thickness and conductivity) of the debris in 16 locations and predicted melt rate using that parameter. Comparison between the modeled melt rates and those we measured with PVC stakes drilled into the ice indicate that this method allows adequate prediction of melt rates using only remotely-measured surface temperature (Figure 2b). We plan to further test this method elsewhere on a larger scale using a new aerial mapping and TIR system.

Figure 2: a) Thermal Infrared (TIR) image of supraglacial debris on Emmons Glacier. Reds and yellows indicate warm temperatures, while blue and violet indicate cool temperature. In this image, the cool areas are more sandy and moist. Note the photographer’s warm boot on the left. The dark cross in the center is a foil-covered orientation marker.

Figure 2: b) Comparison of measured and modeled ablation rates for 16 test sites on the debris-covered glacier surface.
What do our results mean for Emmons Glacier? Our ablation measurements are consistent with the idea that debris-cover reduces melting of the underlying ice. So we can say that Emmons Glacier may be healthier than it would be otherwise, thanks to that rocky debris cover!
Acknowledgments: This work has been funded by the National Science Foundation. We thank Jayne Pasternak, Mariah Radue, Justin Oelschlager, and Andrew Fountain for assistance and logistical help in the field.
