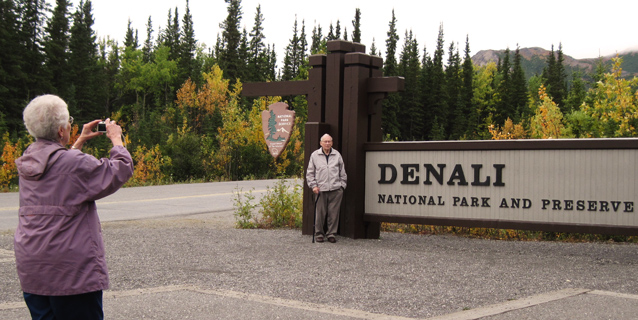
At many national parks, there is an entrance station where visitors can be counted. But, at Denali National Park and Preserve, visitors access the park in many ways and in many locations (e.g., fly to a glacier, arrive at the main entrance by private car, train, or bus, or enter some areas by snowmobile or dogteam).
To estimate winter or summer visitation to Denali, park managers have been adding a variety of visitor counts (e.g., the number of visitors who get winter backcountry permits at the Murie Science and Learning Center; the number of bicyclists at Savage Check Station). In the last decade, summer visitation approximates 400,000 visitors and greatly outnumbers winter visitation (~3,000 visitors). Improved counts for estimating park visitation, especially during the peak season, are desired for managing the park and planning for visitor services.
Old Formula for Estimating Visitation
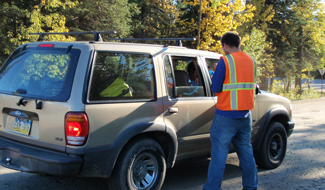
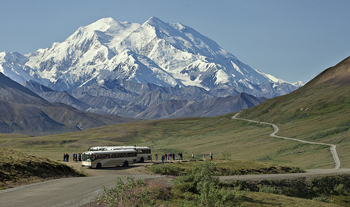
To estimate park visitation when buses are running between May and September (peak season), park staff developed a formula using the results from a 1996 study, in which researchers surveyed a sample of exiting visitors. On a typical day, for every four visitors sampled, three of them had traveled on a bus past the Savage River. Thus, the formula derived from the study was: total number of park visits (in peak season) = number of bus riders x 1.33 (a muliplier based on the ratio of 4 total visitors to 3 bus riders).
Comprehensive Survey of Park Visitors
More than a decade later, park scientists re-apprised the 1996 study and realized that the current bus ridership differs from the 1996 sample. There were several reasons that the methods of estimating park visitation needed to be reexamined: (1) New facilities and trails have been built in the entrance area since 1996, e.g., Denali Visitor Center, a bookstore, the Morino Grill, and the Murie Science and Learning Center. These additional visitor facilities and services have changed how visitors enjoy the park. (2) The development of a new vehicle management plan required an updated and detailed understanding of park visitation. (3) It was an opportunity to evaluate whether Denali should count visits (entry into the park by a visitor during a 24-hour period) or visitors.
Thus, in 2011, a cooperative research study was undertaken to improve the estimate of recreation visits to Denali. Andrew Ackerman, then the park’s social scientist, Peter Fix (University of Alaska Fairbanks), and Ginny Fay (University of Alaska Anchorage) collaborated to: (1) determine the proportion of total May to September visits that include a bus trip beyond the Savage River, (2) assess whether this ratio changes over the May to September time period, (3) understand to what extent visits to (or flights originating from) Talkeetna are double counted, and (4) estimate visitation during the non-bus “shoulder season” of April and May.
Survey Methods
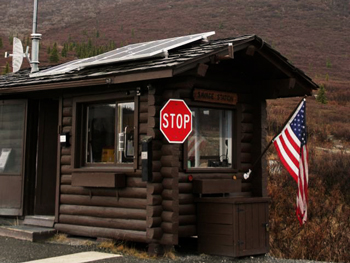
From early April through September, the researchers interviewed park visitors as they left the park. During the April-May shoulder season, the researchers were based at Mile 12 of the park road. During the peak season, the sample times and locations varied from day to day and were selected to include visitors using various modes of transportation—near the Post Office (for private vehicles), at the train depot (for visitors departing by train), at the visitor campus bus stop (for visitors taking shuttles to hotels), and along the Jonesville Trail/Bike Path (for bicyclists and pedestrians). At the Savage River check station (for visitors exiting on tour buses), the researchers boarded exiting buses to poll visitors about their park visit.
Visitors were asked a number of questions about their visit to Denali (whether they traveled past the Savage River, the length of their visit, group size, and whether they visited the Talkeetna Ranger Station or landed on a glacier that same day). At the Talkeetna Airport, visitors who landed on a glacier were asked whether they visited the Talkeetna Ranger Station or the north entrance that same day.
NPS Photo
Findings About Park Visitation
During the study period, the researchers sampled visitors on 88 days and completed 6,108 surveys about the visitors’ visits to the park.
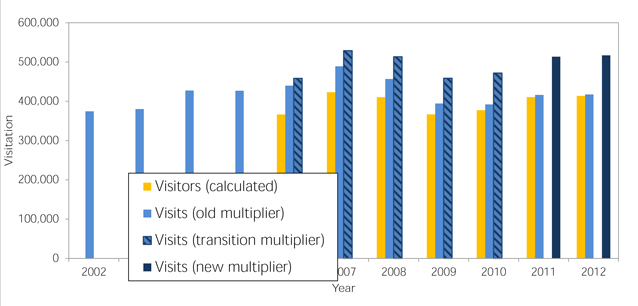
For every 100 visits to the park, on average 41 visits did not include travel beyond the Savage River on a shuttle or tour bus, while 59 visits did. There were only minor variations for June, July, and August in the proportion of visits that travel past the Savage River on the park road. The ratio 41:59, results in a new multiplier of 1.7 that can be applied to bus visits to accurately estimate total recreation visits to the park during peak season.
Applying the new multiplier (1.7) to the 2011 bus ridership of 265,707 results in a change in visitation at the north entrance area from an estimate of 353,390 visits to an estimate of 451,702 visits.
Additional Findings
In terms of double counting, a significant number of visits to the park via glacier landings were followed or preceded by a same-day visit to the Talkeetna Ranger Station (17 percent) or the north entrance (13 percent). However, the number of visits to Talkeetna remains a low percentage (5-10%) of total park visits.
The estimate of visits during the shoulder season when the buses were not running (April 9 to May 18) was 6,885. The majority (68 percent) of these visits brought visitors from Alaska. The percentage of visits by non-local Alaskans increased in May.
On average, based on another 2011 survey (Visitor Services Program or VSP), each visitor made 1.25 visits into the park. Thus, the estimated number of visitors to the north entrance during the peak season in 2011 was 451,702 divided by 1.25—or 361,362. The peak season estimate of visitation (visitors or visits) is then adjusted slightly by adding other counts (e.g., Talkeetna, winter, road lottery) to estimate annual park visitation (see graph).
Confidence in the survey
The researchers compared the survey estimates of shuttle bus visits in 2011 to actual counts from the concessioner. The estimate was within 10 percent. Thus, park managers can be confident that the survey results—and the new 1.7 multiplier—accurately estimate visitation during the peak season.
Last updated: April 21, 2016
