NPS photo
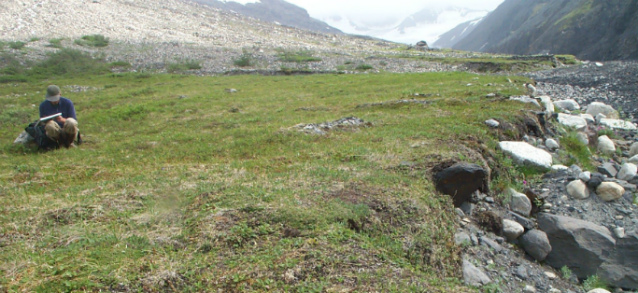
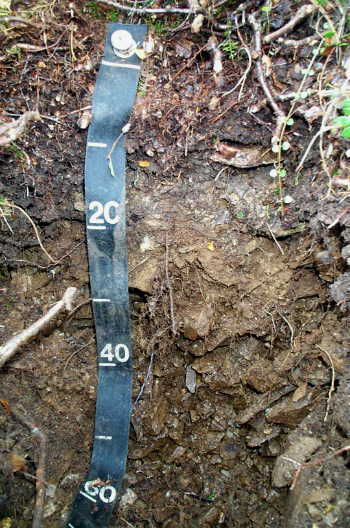
Imagine digging 2,000 soil pits one meter (3 feet) deep. That’s what occupied six summers for a soil scientist and a plant ecologist from Natural Resources Conservation Service (NRCS) in order to map the soils of Denali National Park and Preserve. The resulting Soil Survey of Denali National Park Area, Alaska is one of Denali’s most complete datasets.
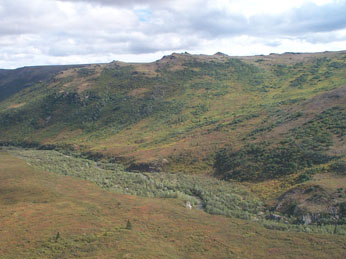
The primary objective of the soil survey was to describe and map the locations of Denali’s soils— from the frozen mica-rich silty slopes supporting alpine-tussock-scrub at high elevations to loamy soils in low elevation boreal and riparian forests. But the survey did more than describe and map soils. It was also a comprehensive ecological survey across the park. At each of more than 2000 points where soil map units were described, the researchers recorded plant species and photographed the landscape, the plant community, and the soil horizons as revealed in a soil pit. Researchers created an ecological classification for Denali from the information about soils, vegetation, and local geomorphology and also fine-tuned the existing ecological classification for Alaska. This survey (inventory) of Denali’s soils was funded by the National Park Service’s Inventory and Monitoring Program.

NPS photo
Soil survey methods
Prior to fieldwork, a physiographic (ECOMAP Subsection) map was drafted to serve as a planning tool. It was assembled for the entire park to integrate relevant information on climate, geology, geomorphology, hydrology, and vegetation. Each year, researchers selected one-sixth of the park (405,000 hectares) for mapping and field documentation. Viewing Alaska High Altitude Photography (AHAP) through a stereoscope, researchers drew tentative soil map unit polygons on Mylar overlays of the aerial photos. Polygons were drawn around areas of apparently similar landform, soils, and vegetation. Representative “study sites” were selected for field work, so researchers could walk transects in several map units during one day.
In the field, after being flown by helicopter to a remote study site, researchers walked along map unit transects stopping to dig soil pits and to record observations about major soil types and associated landforms, site properties, and plant communities. In addition, researchers sampled soils for laboratory analysis and checked if soil polygons had been identified correctly and drawn accurately on the draft soils maps. Field documentation included 2,204 stops along 791 transects in 264 study sites during six summers of fieldwork.
Field data were entered into the Alaska Soil Survey Field Database (SSFDD) for data management and analysis. Maps were revised and confirmed polygons were transferred to overlays of the orthophotos, then scanned and digitized. Results of data analysis were entered into the standard NRCS National Soils Information System (NASIS) database. A revised Subsection map (ecological classification) was produced from the soils map.

Soil survey products
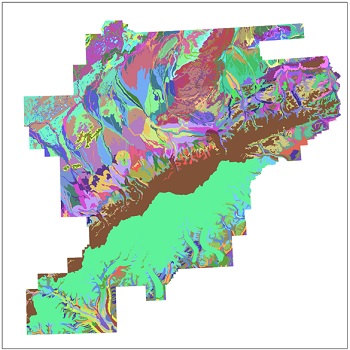
The survey produced a soils map, a comprehensive manuscript, datasets (soil properties, vegetation, photographs) linked spatially to the soils map, and an ecological classification. The soil map for Denali is at a scale of 1:63,360. The manuscript provides tables and descriptions of the 152 Landtype Associations (soil map units), including what soils and potential natural plant communities (Ecological Landtypes) are found in each unit. Two datasets share and link information spatially. The Soil Survey Geographic Database (SSURGO) includes layers for the park boundary and the soil map unit polygons, attributes of the polygons, and metadata (data about the data collection). The Alaska Soil Survey Field Database (SSFDD) dataset includes soils and vegetation data for all the 2,204 sample points, links to the SSURGO database, digital photos, landscape illustrations, soil temperature graphs, and maps showing the distribution of Landtypes and soil map units.

NPS photo
Ecological classification
The ecological classification for Denali was created at a scale of 1:250,000. Soil map units were aggregated by similar physiography and vegetation to create a more generalized ecological map corresponding with a higher level in the National Hierarchical Framework of Ecological Units (ECOMAP 1993, McNab and Avers 1994). Detailed soil units are equivalent to Landtype Association (LTA) map units, and aggregated soil map units are equivalent to the Subsection level. The soil survey gives descriptions of each Subsection with information on what soil taxa and soil map units are found in each.
The detailed Denali soils information and the ecological classification for Denali (Subsection map) were helpful at revising a few map unit boundaries that had been approximated during earlier efforts to map these ecological units across Alaska (Nowacki and Brock 1995).
Applications of the soil survey
The soil survey results can be used in many ways including as a baseline for monitoring potential soil and landcover change. Managers and researchers can query the databases to perform complex spatial analyses of landcover and soil properties. Mapping the ranges of plant species or the extent of soil properties (e.g., presence of charcoal), or soil processes (e.g., colluviation) may show patterns associated with other factors. The analyses can also be used to model wildlife habitat. And, because landscape and soil-detail photos and associated field notes are available for over 2,000 sites in the park, researchers and managers can take a visual trip to potential or selected study areas, and know what species and site characteristics to expect.
References cited
ECOMAP. 1993. National hierarchical framework of ecological units. United States Department of Agriculture, Forest Service. Washington, D.C.
McNab, H. W. and P. E. Avers. 1994. Ecological subregions of the United States: section descriptions. U.S. Department of Agriculture, Forest Service. Publication WO-WSA-5.
Nowacki, G. and T. Brock. 1995. ALASKA-ECOMAP version 2.0. United States Department of Agriculture, Forest Service.
Last updated: February 2, 2025
