NPS photo
In 1986, Denali National Park and Preserve established a limit of 10,512 vehicle trips on the park road during the core summer season. Vehicle use has reached this limit, and the capacity of this vehicle allotment to hold more visitors is limited. With visitation increasing, the park has been pressured to defend or change this limit. In 2006, Denali managers initiated a scientific study to better understand the impacts of traffic volume and traffic patterns on the park’s physical, biological, and social environment.
Synopsis of research 2006-2009
Biologists studied wildlife movements near the park road in 2006 (20 GPS-collared bears) and 2007 (20 GPS-collared Dall’s sheep). Traffic counters monitored road traffic at several locations from 2006- 2009. Social scientists conducted surveys of park visitors about their park road experience (in 2006, they gathered qualitative information about visitor experiences, and used this information to ask specific questions in 2007, in order to select indicators and standards for a visitor’s park road experience). Traffic patterns were monitored beginning in 2006 by installing 130 GPS units on buses and 40 units in NPS vehicles traveling the park road. Beginning in 2007, bus drivers on 20 buses voluntarily used touch screen panels to record information about stops along the park road (e.g., wildlife, passenger drop off and pick up). Researchers gathered information about dust and sound along the park road in 2008 and 2009. A comprehensive model of park road traffic has been developed to predict the effects of changes in traffic volume and timing on visitor experience and wildlife movements.
NPS photo
What’s new in the road study?
Researchers focused on several aspects of the road study in 2009—they analyzed the impacts of traffic on physical factors (dust and soundscapes), reviewed data on the probabilities of seeing wildlife on the park road, and planned new surveys to learn visitor preferences. The results, together with the vehicle use model, are intended to give park managers the science to select a level and pattern of vehicle use that protects park resources and visitor experience.
Studying impacts of vehicle traffic on dust
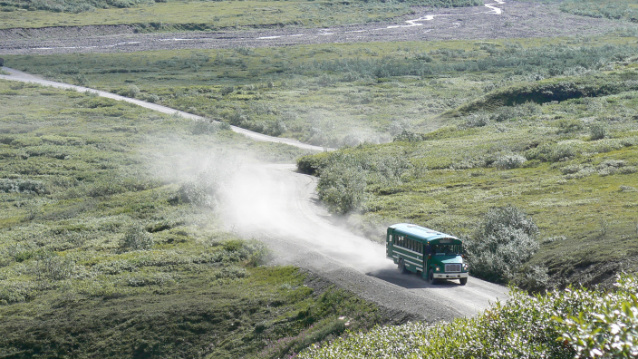
Dust clouds may billow behind buses navigating the gravel park road on a dry summer day. Nearly fi fty percent of visitors indicate that dust is at least “a small problem” that negatively impacts visitor experience. How does traffic infl uence dust along the road corridor? Placing dust “traps” (buckets) along the park road at five sites for periods of two weeks during June, July, and August in 2007-2009 has enabled researchers to (1) quantify current levels of dust along the road, (2) document how far the dust travels, and (3) determine how dust levels diff er for sections of the park road that are paved and unpaved (and either treated with calcium chloride, a chemical dust suppressant, or untreated). If changes in vehicle limits are instituted, repeating the dust study will determine if dust levels have changed in response to new traffic patterns.
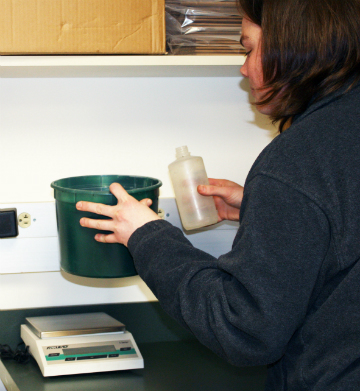
Dust buckets were placed at 5, 25, and 50 meters (15, 75, and 150 feet) from the road edge at Mile 11 (paved), at Mile 23.6 (unpaved, untreated), Mile 29.5 (unpaved, treated), and Miles 51.2 and 55.5(unpaved, untreated).
Dust movement and mitigation
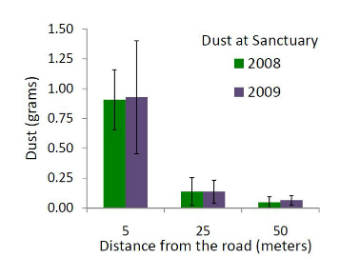
During the two-week sampling intervals, in 2008- 2009, an average of 0.65 grams (0.02 ounces) of dust was collected in the traps near the road at the three unpaved, untreated sites. While weighing less than a paperclip, this dust was over 10 times the dust at the paved site, and 3 times the amount at the treated site. Dust diminished farther from the road (at 25 m, the average dust collected was 0.1 g (unpaved, untreated site), 0.01 g (paved site), and 0.04 g (treated site).
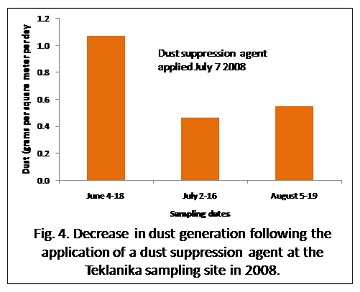
Levels of dust collected in July and August 2008 near Teklanika (the two samples that followed the dustsuppressant treatment) were substantially reduced, demonstrating the eff ectiveness of this agent in limiting dust (see graph at left). The goal of this study is to better understand how dust is generated in relation to traffic levels, use of dust suppressant, distance from the road, and weather conditions— which will allow managers to predict and mitigate for potential dust impacts from new traffic levels.
Effects of traffic on soundscapes
Natural sounds are part of the wilderness experience at Denali. Natural quiet is required by wildlife to hear and respond to sound cues for avoiding predators or perceiving the presence of food or mates. As part of the road study, researchers are studying current levels of traffic-generated sounds near the park road.
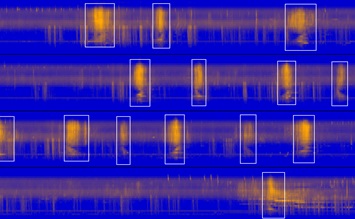
Physical scientists set up sound stations at two sites (east of the Teklanika Rest Stop at Mile 28.1 and at Highway Pass, Mile 59.6). The stations were placed 50 m (150 feet) from road center to correspond to the wilderness boundary. Sounds were recorded continuously for 6-day intervals in July and August in 2008 and 2009 using solar panels and batteries. The recordings were analyzed to give the percentage of time that vehicles were audible, and the number of vehicle-noise “events” during each 6-day period of continuous sampling. An audibility analysis compared detection of sounds by staff listening to visually analyzing the pattern of the sounds on a spectrogram (see pattern above).
The preliminary data collected in 2009 at Teklanika and analyzed visually indicate that vehicle sounds are audible between 0 to 15 percent per hour (early morning versus peak traffic times). Overall there was an average of 162 events in a 24-hour period. Data collection will continue in 2010. The goal is to model and predict potential sound impacts from a change in traffic volume or traffic pattern.
Probabilities of wildlife sightings
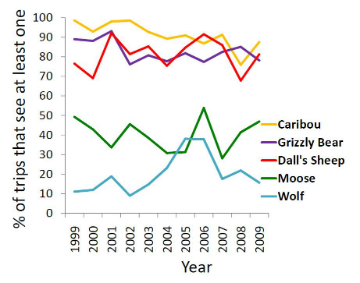
What is the probability of seeing a grizzly bear on the park road if you take a bus to Eielson Visitor Center? Road study staff has analyzed all wildlife sighting data collected in 2008 and 2009. Long-term trends of wildlife sightings along the park road— the probabilities of wildlife sightings (see graph above right) and where they occur along the road specifically—can be scrutinized along with other wildlife census data. If changes in traffic patterns are implemented, then the probabilities of sighting wildlife can be tracked along with population size. If populations stay stable in the face of traffic change, wildlife viewability may not be adversely affected either. However, viewability may respond to other factors such as habitat change in the road corridor.
Additional survey of visitor preferences
In July and August of 2010, researchers from the University of Vermont will return to Denali to administer additional surveys that will further define visitor preferences regarding park road management including how they are willing to trade-off features that were deemed important in previous surveys, such as duration of a tour vs. wildlife sightings, or ability to get on a bus at the time of your choosing vs. crowding at rest stops. The surveys will also gauge visitor interest in early or late tour departures; desire for activities during a tour, such as hikes; and interest in the ability to stop at a visitor center.
Applying science to road vehicle management
Researchers at the University of Minnesota – Minnesota Traffic Observatory produced a traffic model that simulates what the effect is on traffic congestion, vehicle travel time, wildlife road crossings, and visitor crowding—when various factors are manipulated (schedules, volume of traffi c). Using this model will help ensure that any changes to traffic will: (1) incorporate gaps in traffi c—10 minutes every hour to allow sheep to cross the road at Mile 21.6, 37.6, and 52.8 (known migration corridors), and (2) conform with the standards that park managers select for numbers of vehicles visible to a park bus rider at certain stops or in viewscapes. This model will be an important tool for managers to ensure the protection of park resources and the preservation of high-quality visitor experiences.
Last updated: January 3, 2018
