Alaska experiences thousands of earthquakes every year as seismic shifts occur along faults. The Hines Creek fault runs through Denali National Park and Preserve, near Riley Creek Campground. What evidence is there that earthquakes shuddered in this area in the distant past? What are the odds that the ground will rupture again at this fault?

NPS Photo
Paleoseismology in Alaska
These questions are of interest geologically, but there also is an important practical reason for investigating the paleoseismology of the Hines Creek fault. Infrastructure in the area (e.g., buildings, a potential pipeline, or a new bridge to span Riley Creek) must be able to withstand the kind of seismic activity that occurred in the geologic past because such activity likely will happen again.
Paleoseismology focuses on determining the timing, size, and location of prehistoric earthquakes, so that geologists can evaluate the probability and severity of future earthquakes.
Studying the Hines Creek fault
Research on the Hines Creek fault began as early as the 1950s. This fault originally was a strike-slip fault, meaning that the ground on each side of the fault moved horizontally in opposite directions. However, sometime in geological history, the movement at the fault changed; now the north side moves up and the other side moves downward relative to the north side.
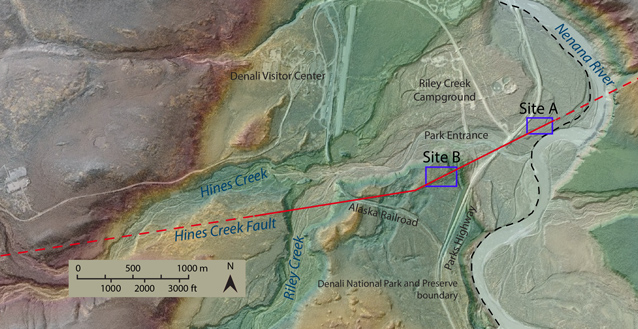
In 2012, Sara Federschmidt, a graduate student at the University of Kentucky, conducted the first paleoseismic study of the Hines Creek fault to document past activity. Federschmidt looked for potential study locations by scrutinizing digital elevation models (DEMs) made from LiDAR (light detection and ranging) data (see image above). She located two types of features where the surface deposits were likely to have been deformed by past seismic activity and thus would be sites to expose and analyze for earthquake deformation.
Federschmidt found fault scarps (“cliffs” created by vertical movement at the fault), but would have needed heavy equipment to conduct paleoseismic studies across the scarp that was 10-12 meters (about 40 feet) tall. Instead, she studied seismic fissures that are secondary features of the surface rupture produced by movement at the fault. The fissures are located near the crest of the scarp on the upper (north) side, and are sunken 1-3 meters (3-10 feet) below the surrounding terrain. The deformed deposits in these fissures provide a record of fault activity.
To study fissures that are filled with surface deposits of different ages, Federschmidt examined and selected study sites on terraces of different heights. Higher terraces, like the ones bordering Riley Creek are presumed to be older than the lower ones near the Nenana River, which are closer to the modern day streambed.

NPS Photo
Field Methods
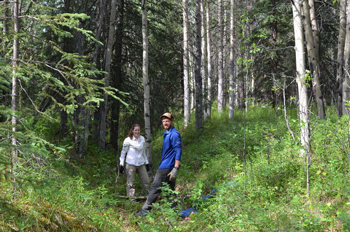
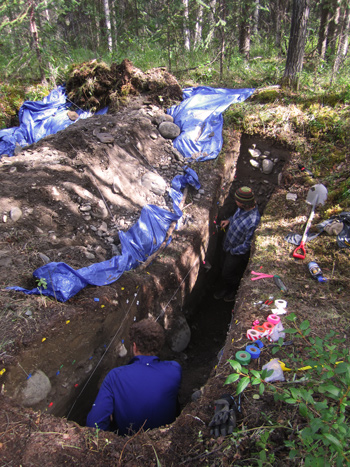
To expose and analyze the earthquake deformation near the fault, after NPS review and approval of the project, Federschmidt and her field assistant dug four temporary trenches across fissures in the terraces (two trenches at Site A, the younger terrace, and two trenches at Site B).
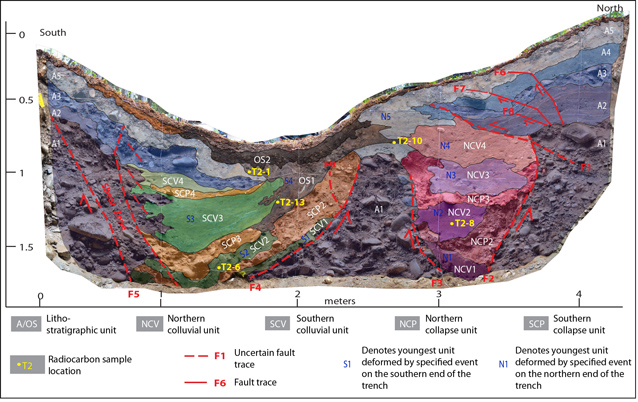
Federschmidt smoothed the trench wall surfaces to examine the deformed layers of sand and gravel. She used nails and string to establish a grid reference system on the walls and used colored flagging to mark stratigraphic units (deposits—originally horizontal—defined by composition; see gray labels on diagram below) and fault contacts (places where fault movement has occurred; see red lines below). In order to radiocarbon date these stratigraphic units, she also collected organic samples (wood and charcoal) from each one.
She photographed each trench wall so that later she could create large maps of the walls, known as trench logs. Federschmidt used these trench logs and the ages of the radiocarbon samples to reconstruct the sequence of earthquake events along this portion of the Hines Creek fault.
Research Findings
Three trenches (one at Site A and two at Site B) included evidence of recurrent seismic activity within the last 10,000 years along this section of the Hines Creek fault. One of these earthquakes—noted at Site A by the sediments of SCP2 (see log below), which indicate disturbance of the ground surface— was determined to have occurred about 1,300 years ago, based on radiocarbon ages of organic material within the overlying unit SCV2 (1,200 years old) and the underlying unit SCV1 (1,400 years old).
Analysis of the trench at Site A yielded a history of at least three earthquakes over about 2,000 years (the approximate age of the terrace as determined by its proximity to the Nenana River). Because the fissures in the older terrace provide a longer time window into the fault’s activity, Site B has the potential to provide a more comprehensive understanding of the fault’s movement—if it can be determined when the seismic activity at the fault began. If the 12-meter (39-foot) offset has occurred over 20,000 years (if the fault became active soon after the retreat of Riley Creek glaciation 20,000 years ago), this offset equates to a slip rate of about 0.6 mm (0.025 inch) per year. However, if the Hines Creek fault did not activate until 10,000 years later, the estimated slip rate would be 1.2 mm (0.050 inch) per year.

What’s next?
No additional research is needed to confirm that the Hines Creek fault has been active in the last 10,000 years. However, future research can learn more about this fault by making use of the LiDAR data that covers an area west from Site A and B about 32 km (20 miles). Perhaps an examination of the LiDAR would reveal other promising scarps or seismic fissures to study. Other deformational features might aid researchers in determining the earthquake history of this fault.
Regardless of future research prospects, it should be emphasized that future ruptures of the fault are likely and should be taken into consideration when planning and constructing new infrastructure.
Last updated: October 26, 2021
