Photo by Jeff Freymueller
Alaska is the most geologically active part of the United States. Ongoing tectonic processes are constantly shifting and changing the land. The Denali Fault, the fastest moving and most active fault in Interior Alaska, cuts through the heart of the Alaska Range and Denali National Park and Preserve. Motion on the Denali Fault and nearby related fault structures is responsible for many of the large earthquakes in central Alaska, and for the high elevation (20,310 feet, 6190 meters) of Mount McKinley that dominates the park landscape. Most people in Interior Alaska were reminded of the fault’s earthquake potential when it ruptured on November 3, 2002. Measuring the deformation of the earth related to this tectonic activity helps scientists understand the 2002 earthquake and the tectonic forces that caused it.
The Denali Fault and Earthquakes
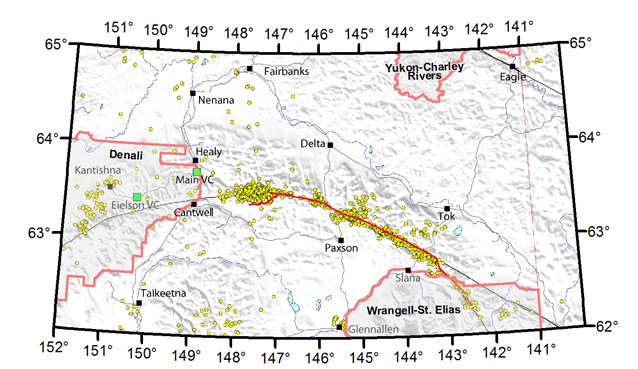
The November 2002 earthquake had a magnitude of 7.9 and caused a surface rupture 325 km (~200 miles) long, mostly on the central Denali Fault (see red line on map below). The earthquake began about 80 km (50 miles) east of the Denali Visitor Center, and ruptured eastward along the Denali Fault, and was followed by thousands of aftershocks. The earthquake caused an offset of nearly 6 meters (20 feet) where it crossed the Richardson Highway and Trans-Alaska Pipeline. The largest surface offsets of 8.8 meters (29 feet) were observed farther to the east. Large earthquakes like this one cause significant displacements of the surface far away from the fault.
Although people tend to view the Earth as static and stable between earthquakes, every point is actually moving slowly as Earth’s tectonic plates move around. Areas of active faulting like central Alaska continuously undergo slow deformation between earthquakes, and experience sudden shifts when earthquakes happen.
The Denali Fault extends across the heart of the Alaska Range, passing just north of the town of Cantwell, through the Muldrow Glacier at the base of the north face of Mount McKinley, and continues to the west. The section of the fault in the park is just as active as the section to the east, and at some point in the future it will also break in a large earthquake. Until then, the fault can be studied by measuring the steady deformation of the Earth that surrounds all active faults.

Photo by Jeff Freymueller
Measuring Deformation of the Earth
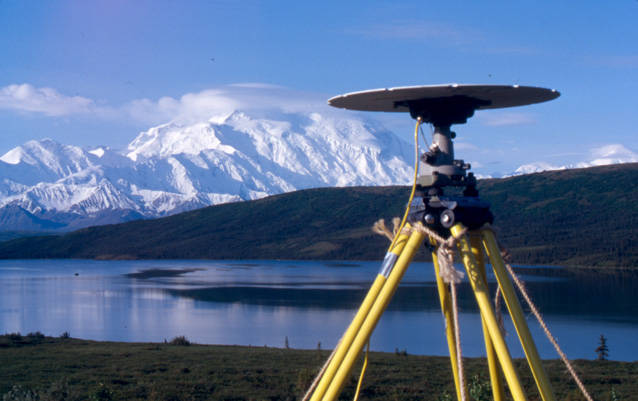
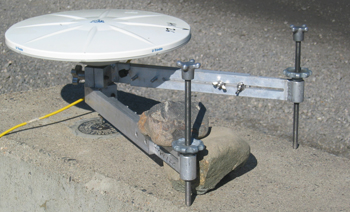
Dr. Jeff Freymueller of the Geophysical Institute, University of Alaska Fairbanks, has been measuring the motion and deformation of the Earth near the Denali Fault by repeating measurements of the position of a survey marker in the ground over a period of years. High precision Global Positioning System (GPS) surveying can now measure positions of survey points with a precision of a few millimeters. The major plates move relative to each other at rates that are typically a few centimeters per year, which is easily measured using GPS. Measurements Freymueller has made across the Alaska Range before the 2002 earthquake show movement across the Denali Fault of 6-8 millimeters per year (1/4 to 1/3 inch per year). Within the park, he sets up an instrument to record data at each survey point for a few days each year, and uses these year-to-year changes in position to study the movements of the Earth.

Changes that Follow Earthquakes
After large earthquakes, the pattern and rate of strain around the fault is often quite different immediately after the earthquake compared to the pre-earthquake time period. Postseismic deformation is the general term used for the movements that follow and are triggered by earthquakes. Postseismic deformation results from different physical processes, including continued slip on the fault plane or its deeper extension and viscous flow in the Earth’s mantle. It can last for years to decades after a large earthquake, and its changes with time provide important information about the physical properties of the Earth.
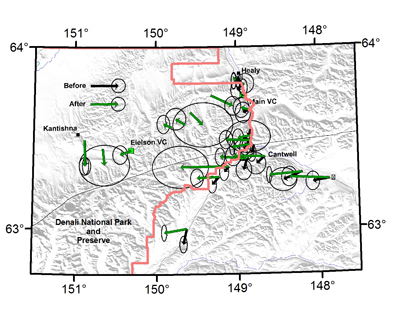
The 2002 Denali Fault earthquake caused changes in the observed motions all across central Alaska. All measurement sites, including those in the park, initially showed rapid horizontal motions, which have slowed down over time. Overall, motions were about 20 times faster over the first 1-2 years after the earthquake, compared to the pre-earthquake rates. Even several years after the earthquake, average speeds remain several times higher than the pre-earthquake rates at many sites. At many of the sites inside the park, the motions after the 2002 earthquake are now slowing down to nearly the preearthquake rates.
What’s next?
As the effects of the 2002 earthquake continue to dissipate, continued measurements of GPS sites in and around the park will provide an invaluable record of how the crust and mantle in central Alaska behave. Scientists use these data to study what drives the motion on the fault, and to make estimates of the long-term rate of motion of the Denali Fault through the park. Combined with geological investigations of past earthquake ruptures on this section of the fault, these studies will allow a better assessment of the earthquake hazards posed by this significant fault.

Last updated: October 26, 2021
