NPS Photo / Diane Kirkendall
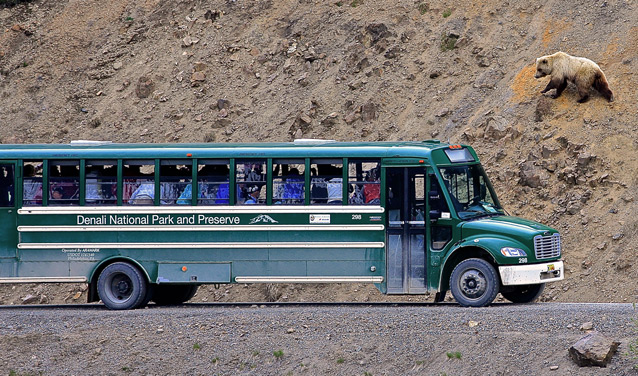
“Look, a bear on the road!” a man exclaims excitedly as his green shuttle bus climbs toward Polychrome Pass. The passengers yell “Stop!” and the driver brings the bus to a halt. Within yards of the bus, a sow grizzly leaves the road, her head swinging as she gobbles blueberries. Her two cubs tussle and tumble behind her; several magpies chatter overhead. Another bus pulls up behind—what has that first bus stopped to see?—and soon its passengers are viewing the bear family. This is the magic of place that many visitors hope to experience in Denali National Park and Preserve while traveling the Denali Park Road by bus
Consider this wildlife viewing experience as a metaphor for the complicated intersection of many things that Denali managers grapple with—visitor expectations, wildlife viewing, wildlife populations in unaltered natural ecosystems, and the park’s oversight of vehicle traffic on the park road. The common denominator is the NPS mandate to ensure that traffic patterns and volume neither reduce the opportunity for exceptional visitor experiences nor adversely impact the ability of wildlife, such as the grizzly and her cubs, to forage and play and move near or across the park road. To guide how NPS manages the park road to carry out that mandate, there is a new (2012) Vehicle Management Plan.
Constructing the park road, keeping a balance
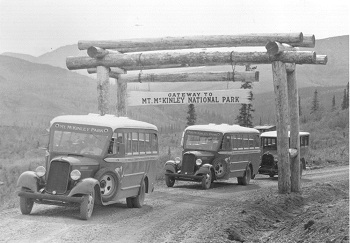
Beginning in 1923, rock was blasted, and gravel moved to create the park road. This 92-mile ribbon of road— winding west from the park entrance to Kantishna— was completed in 1938. From its inception, the park road has provided the primary access to the park.
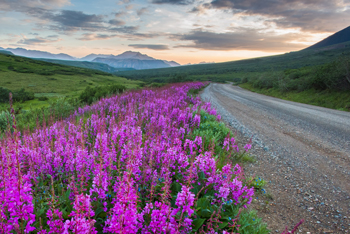
Going west, the road character makes transitions from a paved two-lane road (Mile 0-15) to a gravel two-lane road (Mile 15-31) to a gravel one-lane road (Mile 31- 92). Sections of the one-lane road that traverse high along cliffs pose particular challenges for road crews and drivers to ensure safe travel.
In 1958, the National Park Service (NPS) proposed a road improvement project that would have considerably altered the road’s character. The intent was to widen and pave the entire road and add guardrails and striping. Conservationists, including Adolph and Olaus Murie, fought to protect the “wilderness atmosphere” of the road. Because of their efforts, westbound visitors who cross the Teklanika River are still welcomed by the rustic character of road that has persisted for nearly 80 years. The road improvement story is an example of the challenge faced by national parks—balancing the need to protect park resources while making these resources available for people to enjoy.
This challenge is amplified in Denali, where park managers must balance the growing demand for visitor opportunities to tour the road with the need to ensure that park resources are protected, and visitors continue to have a safe, high-quality experience.
In 1972, park managers anticipated a substantial increase in motor vehicle access to the park resulting from the opening of the George Parks Highway. To protect park resources and visitor safety, they used a special park regulation to restrict private vehicle travel beyond the Savage River and instituted a public transportation system buses.
In 1986, managers set an annual limit of 10,512 vehicle trips (from the Saturday before Memorial Day to the second Thursday after Labor Day or September 15, whichever comes first). This limit includes all vehicles, concessioner-operated buses, administrative use of government vehicles, authorized special permits, Teklanika campers, and Kantishna property owners. Each user group is allocated a portion of the 10,512 trips.
NPS Photo / Kent Miller
A comprehensive study of the park road
Between 1986 and 2006, visitation to the park and demands for bus travel on the park road increased steadily. In 2006, to defend the existing vehicle limit or consider changing it, park managers initiated a comprehensive study to identify how much traffic could be accommodated on the park road (carrying capacity) while protecting park resources and visitor experience.
An interdisciplinary team of NPS and academic scientists conducted the study from 2006 to 2012. The three primary study components were designed to (1) assess vehicle traffic and its impacts (if any) on wildlife movements and sightings from the road, (2) survey visitors to identify and quantify key indicators of a high-quality visitor experience on the park road, and (3) determine traffic patterns and driving behaviors of different types of road users.
NPS Photo / Kent Miller
Visitor experience
Researchers conducted visitor surveys in 2006 to determine what aspects of a trip on the park road make it a quality experience. In 2007, the researchers conducted additional visitor surveys about some of the characteristics that were identified in 2006 to be important in providing positive visitor perceptions, such as the number of vehicles visible at iconic viewsheds.
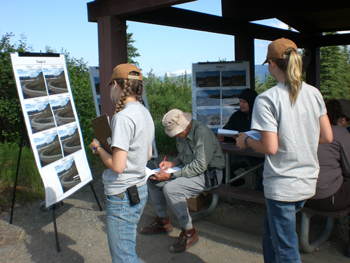
Survey participants were shown a series of photographs depicting crowding by vehicles at wildlife stops, rest stops, and iconic viewscapes. The photographs of these sites had been modified to show a range of 0-12 buses. The researchers asked visitors to describe their reactions to different vehicle crowding levels. On average, visitors preferred wildlife stops when there were fewer than 1.75 buses visible and viewscapes when there were fewer than 2.17 buses visible. These surveys provided park managers with guidance on establishing standards for vehicle numbers.
Traffic patterns
Ecologists used Global Positioning Systems (GPS) units on a subset of vehicles that traveled the park road to determine the speed and driving behavior (including the number and duration of stops) of different types of road users along different segments of the park road. For example, the Denali Natural History Tour traveled about 10 m.p.h. more slowly than other bus types.
Developing Indicators and Standards
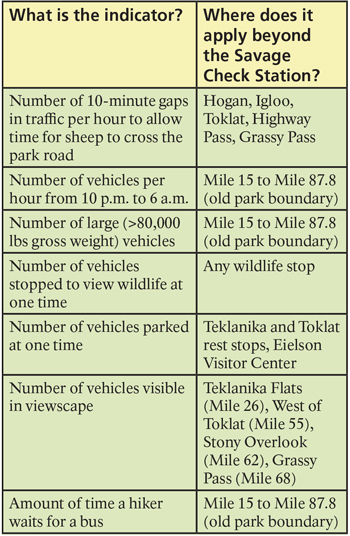
Park managers and planners used the results of the road capacity study to select seven indicators of desired resource condition and visitor experience and to develop quantitative standards for each of the indicators to ensure that the desired conditions are maintained.
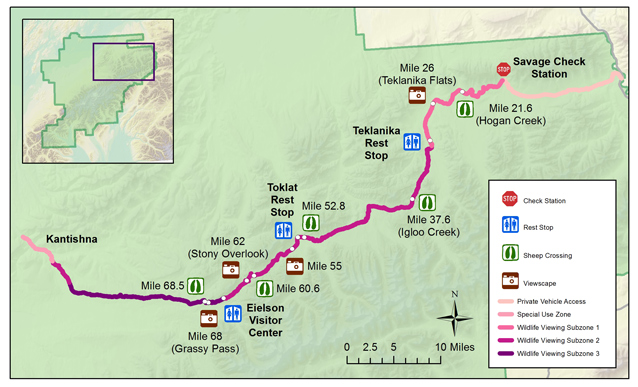
Three of the indicators restrict the amount and timing of vehicle traffic to protect wildlife: (1) hourly 10-minute gaps in traffic at five sheep crossings (see photo below), (2) an hourly limit to night-time (10 p.m. to 6 a.m.) traffic, and (3) an hourly limit to large (>80,000 gross pounds) vehicle traffic. Three indicators that set limits on vehicle crowding were based on results of the visitor surveys (perceptions of visitors toward numbers of vehicles seen): (4) the number of vehicles stopped at the same location to view wildlife, (5) the number of vehicles parked at rest stops, and (6) the number of vehicles visible in four iconic viewscapes. The final indicator reflects the effectiveness of the transportation system in serving the needs of visitors: (7) hiker wait times to catch a bus that has room to take the hiker.
Meeting the standards for each indicator means success in managing the park road for its natural ecology and visitor experience.
Three wildlife viewing subzones were identified (see map above). These zones are subject to different standards (subzone 1 is expected to have the most vehicle traffic and subzone 3 the least traffic). For example, at least 75 percent of the wildlife stops will have 3 or fewer vehicles averaged over 5 years in subzone 1 (this is the standard). The standard is stricter in subzone 2 (2 or fewer vehicles) and in subzone 3 (1 or fewer vehicles).
A traffic simulation model was developed to assess the effects of changes in traffic (amount and scheduling) on the indicators (i.e., spacing of vehicles at sheep crossings and on the types of vehicle crowding that impact visitor experience). This model integrated the traffic patterns (driving behaviors) with the results from the wildlife and visitor experience studies.
How will NPS manage the park road?
After more than six years of scientific study and four years of planning, analysis, and public input, the Denali Park Road Final Vehicle Management Plan and Environmental Impact Statement (VMP) was finalized and the Record of Decision signed by the Alaska NPS Regional Director in September 2012.
Implementation of the VMP took place in stages. Monitoring the indicators began in 2013 and a new concessions contract to operate the park’s public transportation system was finalized in June, 2016. In practicality, the VMP is fully implemented. However, the special park regulation that set a limit of 10,512 vehicles in a season needs to be changed to 160 vehicles per day in the U.S. Code of Federal Regulations.
Because there is some level of uncertainty and unpredictability in the outcomes of most management actions, park managers will use adaptive management in managing the park road. That is, as traffic volumes and schedules are adjusted to optimize the transportation system, and the results of management actions are monitored and better understood, managers will use the information to adjust further the volumes and schedules to make sure the goals of the VMP are being achieved.
The adaptive management strategy includes four aspects to assure visitor satisfaction and natural resource protection in the face of changes in the transportation system: (1) monitor the indicators and standards of desired conditions (some standards require a five-year average), (2) detect any changes in wildlife sightings from the park road, (3) assess changes in wildlife populations using data from long-term monitoring programs, and (4) compare the data gathered before and after the traffic modifications are implemented to a control in order to determine the impact of the new traffic patterns and volumes (known as the Before- After-Condition-Change-Assessment or BACCA study).
During 2013-2015, park staff will develop the specific methods for implementing and for reporting using adaptive management as outlined in the VMP. Monitoring results will be reported to the public on an annual basis.
The VMP will guide management of vehicle traffic during the bus operating season for the next 15-20 years. Monitoring the indicators identified in the VMP will help ensure the protection of the special character of the park road—and the legacy of what the Murie brothers fought to keep decades ago. What better symbol of the success of the VMP will there be than the smiles on awestruck visitors who travel the park road by bus and to view and photograph the wild behaviors of a grizzly and her two cubs right outside the window?
Last updated: October 26, 2021
