NPS Photo
In June 2013, the NPS approved a Winter Plowing Environmental Assessment (EA) plan to open the Denali Park Road about one month earlier than the traditional opening date. As part of the plan, the road will be opened to the Mountain Vista Rest Area at mile 12.6 by mid-February each year for a 3-5-year trial period. During this time, park staff is monitoring soundscapes, wildlife sightings and behavior, and visitor use levels and documenting costs associated with opening the road early. After the trial period, park managers will assess the costs and benefits of a winter road opening for subsequent years.
Methods
The Road Ecology Program (REP) oversees the collection of wildlife observation and traffic use data during the trial period. The winter plowing monitoring period extends from mid-February when the Park Road is opened to the public to Mountain Vista Rest Area to the Sunday closest to March 15, which is the estimated date when normal spring plowing operations would begin. The monitoring dates for this report were:
- 2014: February 15 (Saturday) to March 16 (Sunday) – 30 days
- 2015: February 14 (Saturday) to March 15 (Sunday) – 30 days
Wildlife Behavioral Observations
Visitor Resource Protection (VRP) Rangers and REP staff used Trimble Juno GPS (Junos) units to record data on wildlife sightings including species, number, location, and general behavior while traveling the Park Road from headquarters (mile 3) to Mountain Vista and back to headquarters. VRP Rangers collected information as part of their regular patrols and REP staff roved to Mountain Vista 2-3 times on scheduled sampling days during daylight hours.
In addition to the Juno data, REP staff conducted fifteen minute wildlife behavior observations using protocols modified from previous NPS studies of wildlife behavior. Sightings and behavior of the following wildlife species were recorded within 500 meters of the park road: moose, caribou, wolf, Dall Sheep, grizzly bear and other notable wildlife (e.g., lynx,).
Visitor Use Monitoring
In 2014 and 2015, REP staff monitored vehicle traffic at the Mountain Vista Rest Area for 30 minutes prior to returning east during scheduled wildlife roves. They recorded the number of parked vehicles in 15 minute intervals by vehicle type (commercial, government, private vehicles, and heavy equipment). The count included vehicles in the new “musher’s parking lot” west of Mountain Vista in 2015, and did not include the government monitoring vehicle. Information on outside temperature and number of idling vehicles was added in 2015.
Estimates of overall traffic use were obtained using motion sensor cameras along the Park Road. In 2014 and 2015 a west facing camera just past the headquarters gate was set up to capture vehicles traveling in both the east and westbound lanes. REP staff reviewed all photos and classified passing cars as heavy road equipment, government vehicles, commercial vehicles, private vehicles, unidentified, or pedestrian/non-motorized.
In 2014, the total number of vehicles captured by the camera was divided by two to estimate the minimum number of round trips past mile 3. In 2015, the estimate of round trips was made by counting only “westbound” traffic, as ground-truthing showed that eastbound traffic was often not captured by the camera.
Results
Wildlife Behavioral Observations
2014:
REP and VRP staff collected data on wildlife sightings during 34 trips between Feb 15 and March 16 including 13 trips with no wildlife sightings. There were a total of 21 wildlife sightings and the majority of sightings were moose (16 sightings, group size: 1 to 7 individuals), followed by caribou (2 sightings, group size: 2 to 12), porcupines (2 sightings of the same porcupine), and lynx (1 sighting). Most wildlife sightings occurred near milepost 12. Occasionally more than one staff member recorded data on a given day and data were collected during west and east bound trips, thus some of these sightings may represent the same individual or group documented twice.
REP staff conducted 15-minute wildlife behavioral observations on all wildlife observed within 500 meters of the road. During 15 observation periods recorded in 2014, there appeared to be three documented responses by moose to vehicles on the road (trotting or running away).
2015:
REP and VRP staff collected data on 42 trips between Feb 14 and March 15, including 14 trips with no wildlife sightings. There were a total of 61 sightings of targeted wildlife species; the vast majority were caribou (42 sightings, group size: 1 to 22). The next most frequent species was moose (17 sightings, group size: 1 to 3), followed by one sighting of 2 wolves and one sighting of 35 ptarmigan. Most sightings were between mile 11 and 13. Similar to 2014, some of these sightings represent the same individual or group documented twice.
2016:
Staff collected data on 92 patrols between park headquarters and the Mountain Vista parking area performing 15-minute behavior observations at all 20 wildlife sightings, 12 of moose and eight of caribou. Ninety percent of sightings were located between mile 10 and 12.6. Other vehicles were present at only five sightings.
Two moose became distressed because of quickly approaching vehicles and trotted or ran along and then off the roadway. No obstacles obstructed their movement off from leaving the roadway. After leaving the roadway the moose did not show any signs of distress. All caribou were observed feeding at least 50 meters from the road. Their general response to stimuli was passive.
Visitor Use Monitoring
2014:
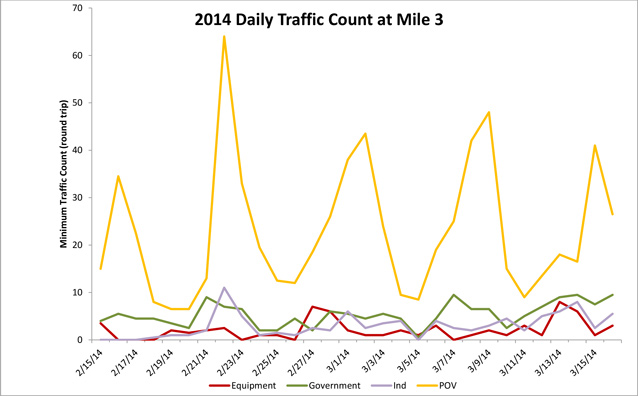
A minimum of 1003 round trips traveled past the mile 3 gate from February 15 to March 16. There were 687 trips by private vehicles, 90 trips by indeterminate vehicles, and one trip by a commercial bus. The remaining 225 trips were by road equipment and other government vehicles. The majority of all trips occurred on weekends (Fig 1).

2015:
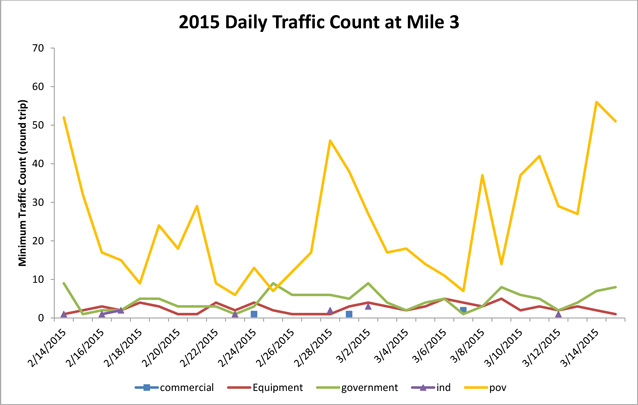
A minimum of 960 round trips traveled past mile 3 from February 14 to March 15. There were 731 trips by private vehicles, 11 trips by indeterminate vehicles, and 4 by commercial operators (including the dog sled concessionaire). The remaining 214 trips were by road equipment and other government vehicles (Fig. 2). Seventy-one (71) pedestrians were documented on the camera. They were overwhelmingly NPS staff or residents.
Ground-truthing of the motion sensor camera has shown that traffic was missed during precipitation (snow) events. Thus, lower vehicle trip numbers in 2015 may be partially attributed to poor weather conditions on March 7. Additionally, a closure of the Park Road at mile 3 on the afternoon of Winterfest (February 28) limited access. Both were Saturdays - the busiest day of the week in 2014.
2016:
Use of the park road during Early Road Opening increased 25% in 2016 compared to 2015. Motion sensor cameras counted 1,259 vehicles during the monitoring period, 75% of which were privately owned vehicles. No commercial vehicles were observed. The majority of trips continued to occur on weekend days. Daily visitation steadily increased starting around March 1st (underlined 'T' in Figure 1). Pedestrians were recorded 64 times – the same levels as measured in 2014 (61) and 2015 (71).
Increased use was not limited to travelling the road, use of the Mountain Vista parking area also increased in 2016. From 135 observations, an average of 5.0 vehicles were parked at the same time (with a maximum of 33 on Winterfest Saturday) compared to an average of 3.6 parked vehicles in 2015. The majority of parked vehicles were privately owned; two commercial vehicles associated with a dog sled concessionaire were observed on one occasion. The number of vehicles observed idling throughout the monitoring period was minor (13).

Mountain Vista parking observations
2014:
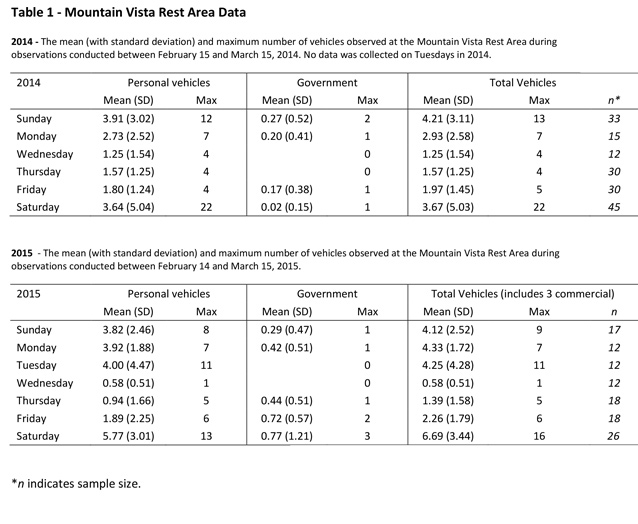
REP staff recorded 165 observations at the Mountain Vista parking during the monitoring period. The vast majority of non-government vehicles appeared to be private vehicles; only one commercial bus was observed. The mean and standard deviation of visitor use was higher on Mondays compared to other weekdays and was likely a reflection of the President’s Day holiday on February 17. Mid-week had the lowest average use, while weekends and holidays had the highest and most variable amount of use. The average number of vehicles was 3 (SD 3.35) and the majority of use occurred between 1:00 pm and 3:00 pm. The maximum of 22 vehicles was observed during Winterfest on Saturday, February 22, 2014 (Table 1).
2015:
REP staff recorded 115 observations at Mountain Vista parking lot during the monitoring period. Again, the majority of non-government vehicles are private vehicles; one commercial van was recorded and two trucks associated with the dog sled concessionaire. Counts for the week of March 7 – 14 were affected by 4 private overnight vehicles associated with the dog sled concessionaire. The average number of vehicles was 3.70 (SD: 3.25) and the maximum number observed was 16 at Winterfest on Saturday, February 28, during a snowstorm. The maximum number of vehicles observed idling in the parking lot at the same time was one (Table 1).
Weather
2016:
The weather of recent winters has likely had a two-fold affect on the amount and kind of visitor use in Denali. February and March of 2016 were warmer and drier than normal (Figure 2). Warm, dry winters may be more inviting to certain user groups and could be driving the observed increases in park road use. Alternatively, warm, dry winters are poor years for many winter activities. Visitor seeking opportunities for skiing, snowshoeing, or mushing may travel to other locations.

Conclusions
While there is a correlation between increased use of the park road and how many years the Early Road Opening period has existed, without a formal survey of visitor motivation, our data cannot confirm (nor refute) a causation between the two.
If such low snow years are the new normal, snowbanks are less likely hinder wildlife's ability to avoid traffic and exit the roadway. However, if the dry trend is aberrant, our data likely underestimates the frequency of future wildlife-vehicle conflicts. The uncertainty between whether warm and dry is the new normal or is aberrant for expected weather is high.
Last updated: July 26, 2016
