NPS Photo / Kent Miller
“The possibility of observing free-roaming wildlife at close range […] in a rugged wilderness setting” is a defining feature of Denali National Park and Preserve as recognized in park management documents. Understanding how wildlife viewing opportunities may be influenced by a growing number of visitors prompted the first study of wildlife abundance and behavior along the park road in 1973. Since 1973, several studies investigated large mammal abundance and behavior along the park road. Each study had a slightly different overall objective and purpose, the data was collected from multiple platforms (from buses versus NPS vehicles), by observers of different trainings, and with variation in sample size (number of trips along the road), destination, and duration (round trip versus westbound recording only). Although data has been collected in a variety of ways, careful analysis of the data can investigate long term trends in the numbers of individuals, groups and behavior of animals visible from the park road. The wildlife sighting data recorded by bus drivers and trained observers constitutes a valuable long term data set that will continue to be collected into the future. This dataset is useful in monitoring wildlife viewing opportunities along the road, a critical part of the visitor experience which managers are tasked to maintain.
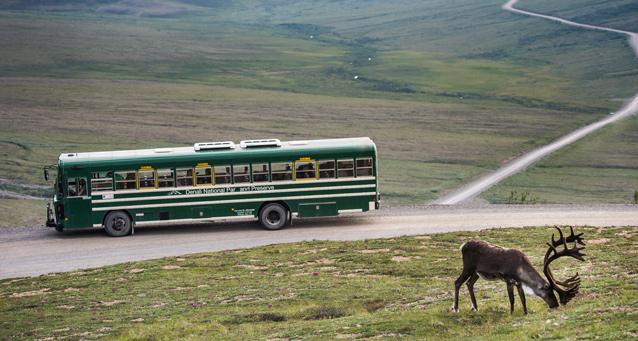
Beginning in 1996, bus drivers and park staff have recorded data on wildlife sightings the numbers of bears, moose, sheep, caribou, and wolves they see on trips along the park road every year. Initially, data was collected on paper data sheets, but starting in 2006, touch screen panels linked to GPS tracking units on twenty buses allowed the automated collection of wildlife stop data. From 2012 to 2014, message display terminals (MDTs) were installed in the entire bus fleet, in conjunction with a realtime GPS tracking system, replacing the touch screen panels.
Additionally, trained observers collect detailed information on wildlife sightings such as number of individuals and distance from the road. The use of trained observers to record wildlife stop attributes began in 2010, called the Ride Observe and Record (ROAR) project. ROAR observers use handheld GPS receivers for collecting detailed information about wildlife sightings along the park road. ROAR observers collected data on 158 round trips as far as Eielson in 2014, recording detailed information on 2642 wildlife stops along the park road.
We calculate an annual sighting index which is a measure of how often observers on westbound trips to Eielson Visitor Center saw a member of a species in a given year. Although we believe that changes in this index are a good indicator of how overall chances of seeing a species might change over time, these rates are not direct estimates of a visitor’s chances of seeing a given species in a year.
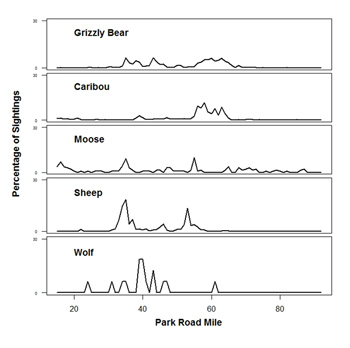
The annual sighting index, presented as a percentage of trips on which at least one individual of each of the “big five” species on a bus trip at least as far as Eielson Visitor Center in 2014 was:
- 66% for grizzly bears
- 70% for caribou
- 63% for Dall’s sheep
- 29% for moose
- 6% for wolves

The 2014 sighting index for bear, caribou or moose were the lowest estimates from the time period from 1997-2014. From 1997 to 2013, the average index for bear, caribou and moose were 83%, 89%, 41% respectively. However, the reduction in the annual sighting index for these species may reflect a change in the proportion of sightings occurring during the westbound portion of the trip rather than a real reduction in the number of each species seen. In most years, a majority of sightings for each species were recorded during westbound travel, but in 2014, a roughly equal proportion of sightings for bear, caribou and moose were recorded during west and eastbound travel. The average number of bears seen per trip in 2014 (1.93) was slightly above the average from 1997-2013 (1.89), however the average number of caribou and moose seen in 2014 (2.51 and 0.39 respectively) were slightly less than the average seen from 1997-2013 (2.88 and 0.58 respectively).
The sighting index for sheep in 2014 was the same as in 2013 (63%) which was lower than the average sighting index for sheep from 1997-2013 of 79%. The probability of seeing a wolf in 2014 (6% of trips saw a wolf) was higher than the previous year when an estimated 4% of trips saw a wolf. The average sighting index for wolves from 1997-2013 was 17%.
Last updated: February 23, 2016
