NPS Photos
During the summer of 2013, Denali had 14 fires including several large fires with a total of 104,850 acres burned within the park boundary. Based on the fire perimeters it appeared that several Central Alaska Network Inventory & Monitoring (CAKN) vegetation mini-grids (75 total plots) were burned by three 2013 fires in the park. As mentioned above, burn severity strongly influences the impacts of fire on vegetation succession, lichen/moss consumption, and active layer thaw. However burn severity is often difficult to assess several years after a fire. Since many of these plots were not going to be re-measured by the CAKN vegetation crew for another 5 to 10 years, the NPS Fire Program worked with CAKN to develop a plan to monitor these burned plots for severity and initial fire effects.

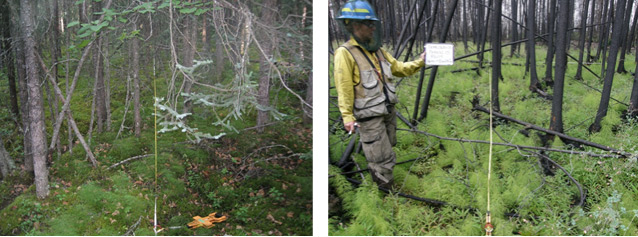
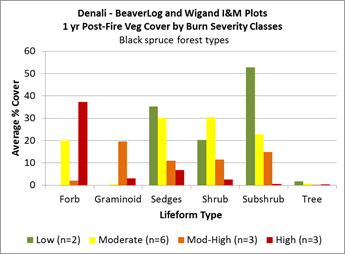
In 2014, the Denali fire crew and regional fire ecologists measured burn severity and 1 year post-fire effects at two of the burned mini-grids (38 plots). A diversity of burn severities and vegetation types were sampled, including: black and white spruce forests, paper birch forests and tussock-shrub tundra. Based on ocular cover estimates, the average vegetation cover 1 year post-fire are shown in Figure 1 for the black spruce forest plots sampled. In general the vegetation cover reflected expected changes 1-yr after a fire for the burn severity classes. Sites such as the mesic feathermoss black spruce forest plot shown in Figure 2 resulted in the high forb (herbaceous plant) cover after a relatively high severity burn occurred. A majority of the understory plants were fireweed and horsetail at this site, but the pale green and pink flowered plant in the 2014 photo was Cordyalis sempervirens, which will only flower for a few years after a fire disturbance, and then the seeds will lie dormant in the soil until the next disturbance.
The primary intent of monitoring the Inventory & Monitoring (I&M) plots for burn severity was not to assess how well the remote sensed dNBR burn severity maps worked, since the plots were established on a grid and not selected based on a range of severities. But determining how well the burn severity maps work for assessing severity at a random plot location is important. A comparison of the burn severity from the ground versus the burn severity dNBR from remote sensing showed a fairly good fit (r2 = 0.63, see Table 3). This suggests that the dNBR maps could be useful for assessing relative burn severity at the plot level.
Assessing these fires and plots provided an opportunity to improve our understanding of how fire changes vegetation, permafrost, soils and potential impacts of climate change. This data will provide information for the long term monitoring of natural fires for Denali. The project is an excellent example of a co-operative effort between the NPS Fire Program and the CAKN Inventory and Monitoring Program.
Last updated: July 29, 2016
