NPS Photo / Tim Rains
Purpose:
The motivation for this project came from the observation that treeline, shrubline, and tundraline are 200 to 400 meters higher in Wrangell-St. Elias National Park and Preserve and Yukon-Charley Rivers National Preserve relative to Denali. This difference in vegetation line may be due to warmer growing season temperatures in the interior part of the state where Wrangell-St. Elias and Yukon-Charley Rivers are located. However, we need more detailed climate data than is currently available to answer this question. This project seeks to fill in this gap and explain the observed differences in vegetation line between the eastern AK parks and Denali.
Implementation:
Starting in the spring of 2010, we placed air and soil temperature sensors (10cm into mineral soil) every 125 m in elevation along a north and south transect on Mt. Healy for the duration of the growing season. We started at valley bottom and continued upward until we reached the elevation where tundra turns to rock. Starting in 2013 we placed sensors reliable in winter conditions on the Mt. Healy transects as well as in Yukon-Charley Rivers in the Ogilvie Mountains. In 2014 we additionally installed sensors in Wrangell-St. Elias off the Nabesna Rd. At each temperature sensor location, we measured the depth of the living material (moss, lichen, flowering plants or dwarf shrubs) and the depth the organic layer in the soil (decomposing organic material). We also measured a suite of vegetation characteristics so we can relate measured temperatures directly to plant species occurrence, percent cover and structure. Starting in 2015 we began a partnership with climatologists to use the temperature data collected from this project to create spatially explicit maps of soil and air temperatures in the regions we have installed these temperature sensors. These maps can be used to explain current vegetation patterns.

Results/Updates:
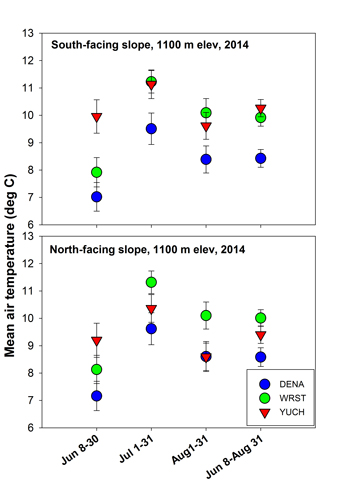
In the spring of 2015, we visited the temperature sensor locations in the three parks to download data, allowing us to compare temperatures from all three parks and test our hypothesis that the growing season temperatures are warmer in Wrangell-St. Elias and Yukon-Charley Rivers relative to Denali. The air temperature data confirmed our hypothesis. For a given elevation, air temperatures were on average 1.5 deg C warmer in Wrangell-St. Elias and Yukon-Charley Rivers compared to Denali during the growing season (Fig. 1 compares air temperatures taken at 1100 m in each of the parks). This temperature increase is roughly equivalent to dropping 230 m in elevation (you generally gain about 1 deg C for every 150 m in elevation descended) and could explain the higher vegetation lines in Wrangell-St. Elias and Yukon-Charley Rivers relative to Denali.
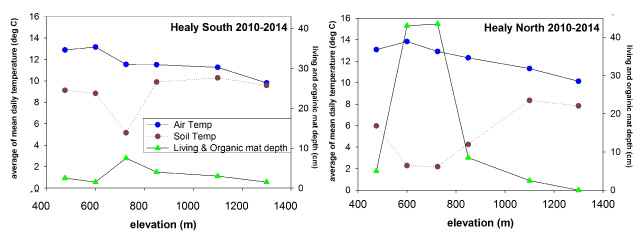
Soil temperatures showed a different story. Summer soil temperatures are inversely related to the depth of living and organic mat (Fig.2). Thick mats of vegetation and decomposing organic material insulate the soil in the summer, keeping it cool and buffered from fluctuating air temperatures. This relationship results in having a greater temperature disparity between the air and soil at lower elevations, where vegetation and organic mats can be quite thick, particularly on north-facing slopes, and little difference at high elevations where vegetation and organic mats are thin. Consequently, soil temperatures from the three parks reflect the local vegetation and organic mat depths and not broad regional differences (data not shown). Thus, while air temperatures show broad regional differences between the three parks, soil temperature differences do not.

Last updated: April 19, 2016
