NPS Photo / Kent Miller
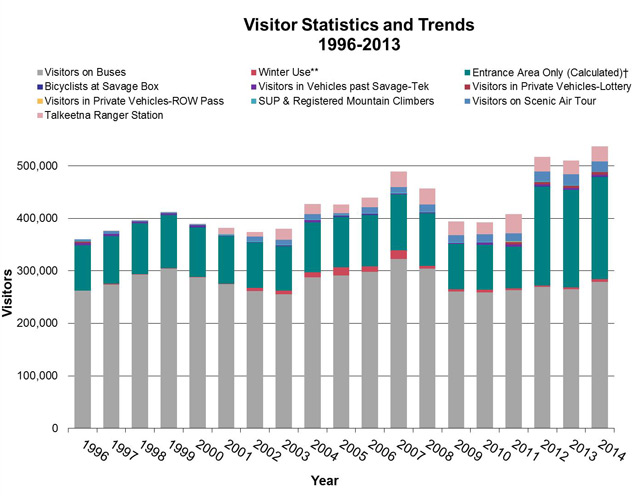
Since the completion of a park visitation study in 2011, a new formula has been applied to subsequent years to calculate park “recreation visits”. Previous park visitation statistics were based on formulas derived from 1996 data. The previous formula underestimated visits in the Entrance Area. When the new formula was applied, there was a significant jump in visits with 510,521 occurring in 2013 and 537,434 in 2014. Visitation to the park continues to be on the upward trend as recreation economies recover from the 2008 regression. Bus visits have remained steady with an average of 267,209 visitors over the past five years. Winter use has seen a reasonably large increase in recent years, from 3,133 in 2013 to 5,200 as of January 2014. Entrance area visits (visits going no further than mile 13 on the Park Road) have increased as well.


Visitor Counting at the Denali Visitor Center
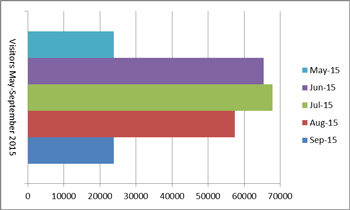
In 2014, Denali National Park and Preserve installed automated counters at the Denali Visitor Center (DVC) to count visitors entering and leaving the building. The information collected was then used to calculate both total visitation to the visitor center during the sampling period and the average hourly and daily visitors. The automated counts were 1.6 times greater than visitor counts generated manually (with human error) even after taking account for errors and double counting of visitors leaving the building. Overall, the visitor center experiences higher visitation rates from year to year. For instance, from May 15 to September 11, 2015, total visitor counts came to 238,317 which are up from 223,353 in 2014. July, the highest visitation rate month in the park, welcomed 67,819 visitors. Automated visitor counts were compared to visitor counts taken by employees at the DVC front desk from July 25 through September 12, confirming the higher counts generated by the automated counters.
Visitor Use and Experience in 2016
This year, Denali will embark on collaborative projects with university student and faculty researchers to assess trends in visitor experience of the park’s landscapes, wildlife, soundscapes, and transportation. One particularly important study will assess the level of noise visitors experience in the Denali Visitor Center campus and Riley Creek Campground and how that may impact enjoyment and use of Denali’s park entrance area. Another study will focus on determining visitor density and crowding issues along the park road and the increasingly busy backcountry areas of the park. Monitoring changes in the type and level of demographic shift in Denali Park and Preserve visitation, as well as areas of new visitor concentration, will help Park managers alleviate potential impacts to the wilderness character of Denali’s landscapes, scenic views, and wildlife sightings.
Last updated: April 7, 2021
