NPS Photo / Kent Miller
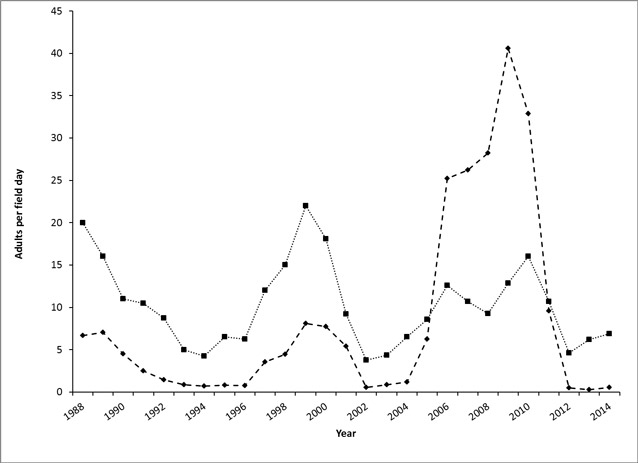
NPS biologists calculate annual indices of abundance for snowshoe hare and willow ptarmigan in Denali by recording the number of adults of each species detected during routine field activities and other survey work from mid-April through June. These data allow biologists to monitor the frequency and magnitude of the population cycles of each species over time.
The graph that follows shows the number of snowshoe hare (solid black diamonds) and willow ptarmigan (solid black squares) detected per field day from 1988 to 2014 in Denali. Our field data suggests that both species are in the increasing phase of their cycles. These long-term data are important for monitoring the amplitude and frequency of cycles of both species in Denali and across their range (see Krebs et al. 2013, Krebs et al. 2014).

More Information
Krebs, C.J., et al. 2013. Synchrony in the snowshoe hare cycle in northwestern North America, 1970-2012. Canadian Journal of Zoology 91: 562-572.
Krebs, C.J., et al. 2014. What factors determine cyclic amplitude in the snowshoe hare cycle? Canadian Journal of Zoology 92: 1039-1048.
Last updated: September 18, 2017
