NPS photo
As global temperatures rise, natural landscapes are being transformed. Landscapes with permafrost soils (frozen for at least two years), such as those in and near Denali National Park and Preserve, are likely to exhibit dramatic changes because the thawing of ice-rich permafrost physically alters the environment.
Thermokarst terrain develops when permafrost ice melts, drainage occurs, and the ground surface subsides creating localized depressions. Because permafrost soils naturally include patches of varying ice content, a topographic mosaic is created as the soils thaw. The presence of thermokarst indicates change has taken place already. But the physical changes in topography (ground subsidence) can alter other aspects of the landscape too, such as vegetation, soil organic matter decay, and surface hydrology (soil moisture and water flow).
NPS photo
Carbon Cycle and Permafrost Thaw
Such potential changes in vegetation and organic soil decomposition created by permafrost thawing can alter the carbon cycle of the ecosystem, a change that is visually more subtle, but one with far-reaching major consequences. Vegetation removes CO2 from the atmosphere, so any changes in vegetation resulting from thawing permafrost can aff ect the rate and magnitude of carbon (C) uptake.
Permafrost soils store vast quantities of organic carbon, perhaps over twice the amount of carbon as in the atmosphere. This store of carbon has the potential to be released into the atmosphere if permafrost thaw causes physical changes of the landscape (subsidence, warming soils) that increase decomposition. Thawing permafrost creates a deeper active layer (the surface soil that thaws and freezes each year) potentially resulting in large amounts of organic matter being exposed to above-freezing temperatures for longer periods of time. This change creates conditions that facilitate the decomposition of soil organic matter by soil micro-organisms, and that result in carbon being released to the atmosphere.
NPS photo
Studying Landscape Changes
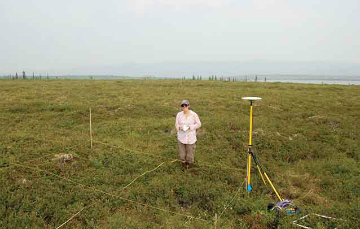
Because of these complex ecosystem interactions, to better understand the effect of warming temperatures on the carbon cycle (i.e., the net effect on ecosystem carbon storage), Dr. Ted Schuur and graduate student Fay Belshe from the University of Florida are quantifying both what happens to soils and what happens to vegetation as permafrost thaws.
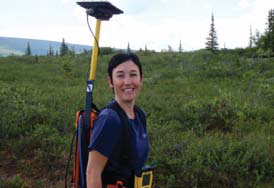
Using a combination of technology (e.g., Global Positioning Systems (GPS) and high-resolution satellite imagery) and ecological data (measurements of soils and vegetation), the researchers are studying how the landscapes near Eight Mile Lake in the Stampede Corridor, just northeast of the park, are changing over time. Specifically their objectives are: (1) to create a detailed map of the changes in vegetation and topography created when permafrost thaws, and (2) to quantify the scale at which these changes are occurring over the landscape.
Classifying Thermokarst Landscapes
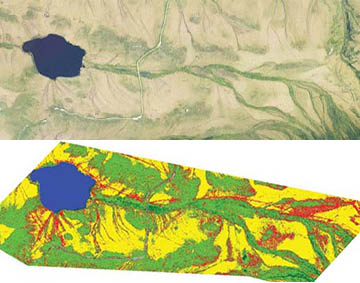
To create a detailed map of changes in vegetation and topography—created by thawing permafrost— Schuur and Belshe first obtained a high resolution satellite (IKONOS) image for the Eight Mile Lake watershed. Using a computer, they classified the landscape image into landcover classes based on where the computer detected similar color patterns (wavelengths) within the image (see bottom map).
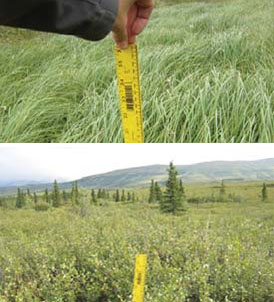
After using the automated classification to find sites on the ground representative of different landcover classes within the watershed, the researchers sampled 80 plots—2 m x 2 m (3 feet x 3 feet)—to gather more detailed information about vegetation and soils. Within these “ground” plots, the researchers estimated the percent cover of the dominant vegetation, and also measured the average vegetation height, soil moisture, depth of the active layer, and depth of the organic layer. To quantify changes in elevation and the slope of the landscape due to thermokarst, they walked transects covering the Eight Mile Lake watershed and recorded data using a high-precision GPS.
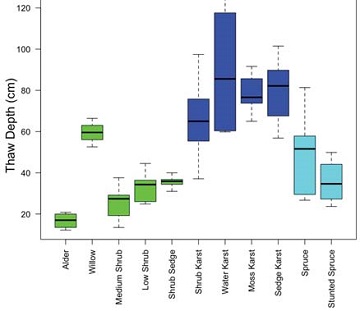
Using the information collected on the ground from both the plots and GPS transects, the researchers grouped the plots based on similarity of plant, soil, elevation, and environmental measurements to produce 11 landcover classes. Of these 11 classes, two were dominated by spruce trees, five were dominated by shrubs, and four occurred within areas where permafrost thaw resulted in ground subsidence (thermokarst).
Attributes of Landcover Classes in Thermokarst
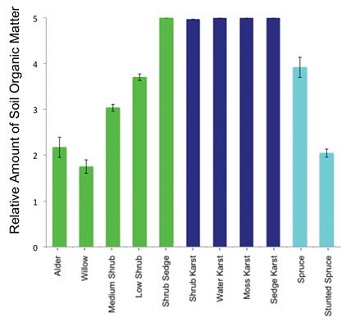
The four thermokarst (“karst”) landcover classes had different dominant ground cover (shrub, sedge, moss, and water) and differed in elevation (topographic position). However, all four classes were characterized by (1) high soil organic matter (see navy bars in graph at upper right), (2) greater depth of the active layer (see navy bars in graph at lower right), and (3) relatively high soil moisture content. Thermokarst landcover classes, because of these soil properties, are likely to experience increased decomposition of organic matter and release C to the atmosphere, thus affecting the carbon balance of the ecosystem.
What's Next?
Schuur and Belshe will have a computer take the data and generate a map of Eight Mile Lake watershed showing the spatial distribution of the 11 landcover classes. From this map, the researchers can identify where thermokarst terrain is, and quantify how warming and permafrost thaw are aff ecting C storage in the entire landscape. The landcover classification could be applied to satellite images of Denali to understand how Denali’s permafrost landscapes may change.
Last updated: July 28, 2016
