The complexity of the population dynamics of a large herbivore in the natural world is overwhelming.

NPS Photo / Kent Miller
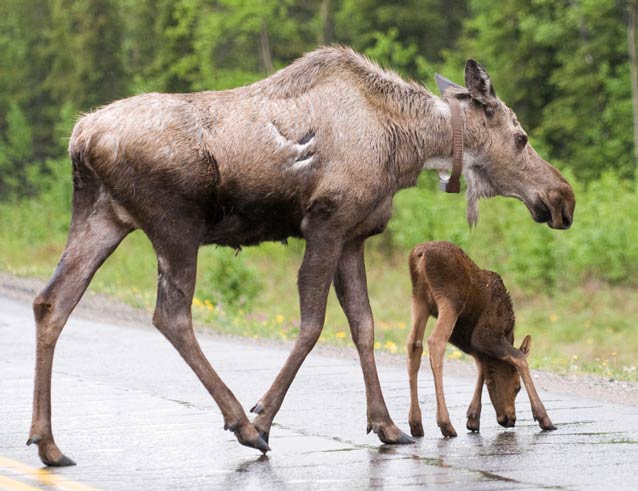
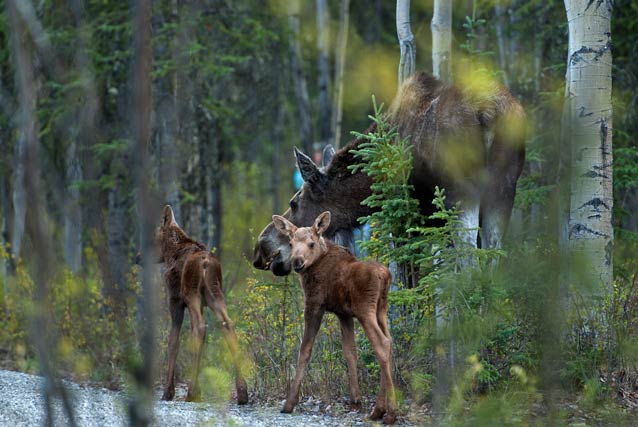
Moose (Alces alces) are Denali’s largest herbivores, weighing up to 1500 lbs. It’s not uncommon to see a cow and calf browsing on willow shoots along the side of the park road, or to watch a bull partially submerged as he clips aquatic plants from a tundra pond. Sometimes moose seem to “disappear” into an alder thicket.
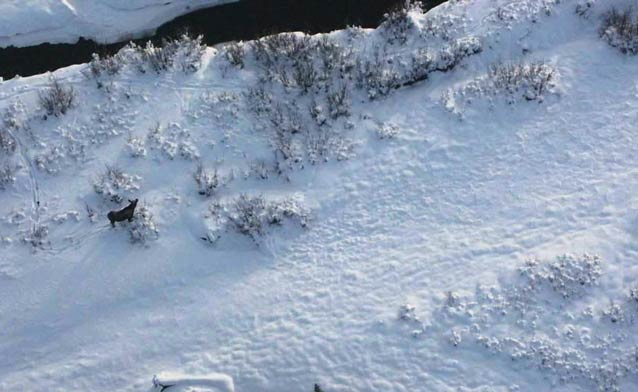
Counting all the moose in Denali National Park and Preserve, and determining the ratio of bulls, cows, and calves to check on the status of the population, would require finding all appropriate moose habitat and observing each moose. Because it is not feasible to do so, park managers rely on accurate estimates of moose population size, age structure, and sex ratios to evaluate if moose populations have remained “natural and healthy.” Estimates also help managers set hunting limits. (Subsistence hunting is allowed in the new park and in the preserve, and sport hunting is allowed in the preserve.)

NPS Photo
Development of Survey Techniques
Early techniques used to estimate moose population numbers in North America included counts of moose droppings and various aerial surveys such as quadrat sampling, line transect sampling, and indexes of relative abundance based on the number of moose observed per flight-hour.
An aerial stratified random sampling method used in Alaska in 1978 was refined over the years into the standard technique employed by most agencies through the late 1990s. Known as the Gassaway stratified random sampling technique, it used survey units that varied in size because they were delineated by topographic features. Biologists continue to use preliminary surveys to stratify survey units as “high” or “low” depending on the number of moose observed. Then, during the actual survey conducted for a sample of units drawn randomly from “high” and “low” units, biologists record the moose in each unit by sex and size (adult or calf). Statistical analyses are used to estimate population size and sex and age composition.
In the late 1990s, Jay Ver Hoef used spatial statistics to improve the basic approach of stratified random sampling. This newer method is valued because the size of the overall survey area can be much larger, the systematic sampling design gives biologists more flexibility in selecting units to survey, and the estimates are more accurate. In addition, because GIS technology is used to lay out the units on a statewide grid (based on minutes of latitude and longitude), these coordinates can be used to navigate the borders of the units by aircraft—making this method substantially easier to conduct.

NPS Photo / Katie Thoresen
Recent Survey Information
Based on the last successful survey conducted with adequate snow cover (2011), there are an estimated 1477 moose in the survey area on the north side of the Alaska Range, or about one moose for every 6.7 square kilometers or one moose for every 2.6 square miles. Biologists actually observed only 496 moose in the units surveyed, but when the density is extrapolated to the units not surveyed, the population estimate for the entire survey area totals 1477 moose (with 90 percent certainty that the estimate is within 20 percent of the actual number of moose in the area).
The calf : bull : cow ratio was 29 : 53 : 100, meaning that calves, bulls, and cows represented 16, 29, and 55 percent of the estimated population, respectively. If there are too few cows or calves, the future population size might be expected to decline. More than three-quarters of the cows (75 percent) were without calves, less than one-quarter of cows (21 percent) had 1 calf, and 4 percent of cows had twin calves.

Population Trends
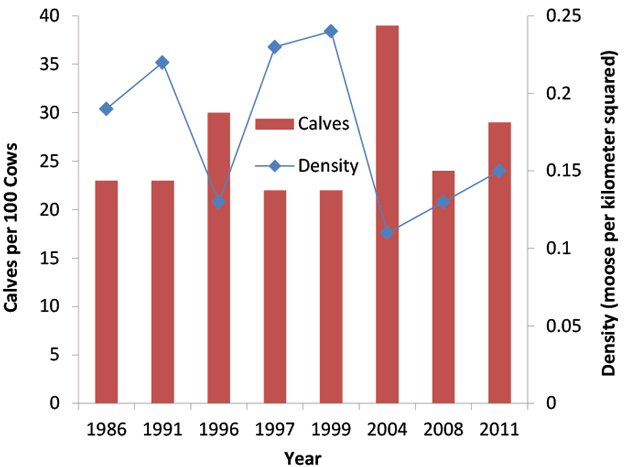
Survey results (estimates of population number and density) are difficult to compare among years because survey areas and unit boundaries have varied. Attempts have been made to keep overall survey areas similar so that comparisons of results among years and methods are meaningful (see graph above).
Monitoring Moose as a Vital Sign
Denali is one of three parks in the Central Alaska Network (CAKN) for Inventory and Monitoring (I&M)—the other parks are Yukon-Charley Rivers National Preserve and Wrangell-St. Elias National Park and Preserve. These parks represent intact, naturally functioning ecosystems in subarctic Alaska.
Information generated by the I&M networks about “vital signs” of park health and disturbance pressures can be used in management decisions affecting the preservation of park resources.
“Moose populations” is one of the 18 vital signs selected to gauge the biological integrity of Central Alaska Network parks (36 vital signs in all). Because moose population change is typically slow, population estimates conducted once every three years would be adequate to detect change in abundance, distribution, or composition, and would be more practical (less costly) than annual surveys.
Thus, a moose survey will be conducted annually by CAKN, following standard monitoring protocols, but will rotate among the three parks. The next rotation will be Wrangell-St. Elias in 2013, Denali in 2014, and Yukon-Charley Rivers in 2015.
Part of a series of articles titled Denali Fact Sheets: Biology.
Previous: Rutting Behavior of Moose
Last updated: April 22, 2016
