NPS Photo
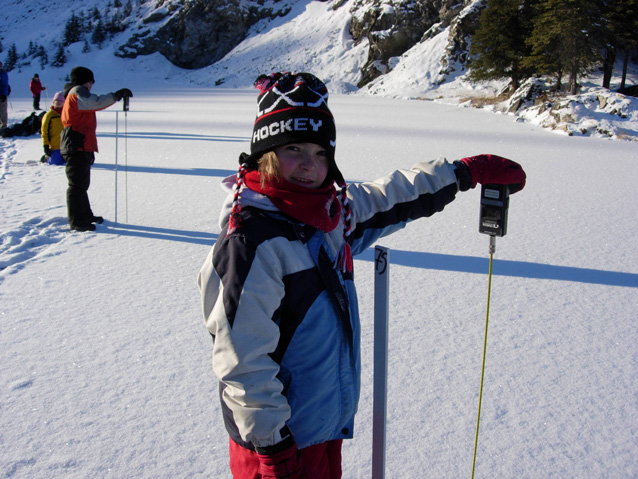
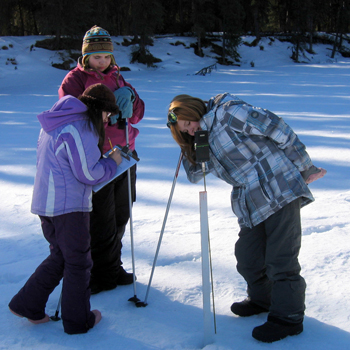
A handful of elementary students scrambles out of the bus at the trailhead to Horseshoe Lake. Bundled in snow pants and clutching equipment in mittenclad hands, the third- through fifth-graders eagerly tromp and slip along the snow-packed trail down to the frozen lake. Despite the shouts and giggles along the way, the lake is more than a fun winter field trip to Denali National Park and Preserve. It is both a research site and hands-on outdoor classroom.
Alaska Lake Ice and Snow Observatory Network
These students are engaged in a special program— Alaska Lake Ice and Snow Observatory Network, or ALISON. The project was designed as a 10-year research and education program to provide Alaska teachers and students with an opportunity to learn about scientific inquiry in “their own backyard.”
ALISON was conceived by Dr. Martin Jeffries, University of Alaska Fairbanks (UAF), and colleagues as a way to monitor lake ice and snow conditions around Alaska, enlisting students and teachers to collect the data. ALISON protocols were developed by Jeffries and Kim Morris, also of UAF, in the winter of 1999-2000. The researchers wanted to create a long-term dataset that could be used to discern the impacts of global change on lake ice. The duration of ice cover on northern hemisphere lakes is a sensitive indicator of climate variability and, on average, has decreased by 20 days over the last 150 years.
Horseshoe Lake and ALISON
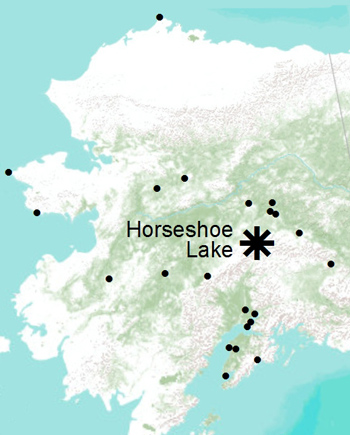
Distributed around Alaska, the original array of about 20 study sites (see map at right) took into account the east-west and north-south climatic gradients in the state. The Horseshoe Lake site was one of nine sites representing the climate of interior Alaska. Students from Tri-Valley School in Healy (11 miles north of the park entrance) participated beginning in the winter of 2003-2004.
Now that the 10-year formal statewide collaboration of scientists, students, and teachers has ended, Tri- Valley School teachers continue to inspire young scientists by helping youngsters collect data about lake ice and snow. Students return several times each winter, when Horseshoe Lake is frozen, to measure the ice thickness and the depth, density, and temperature of the snow layer on the ice. The teachers have incorporated ALISON as part of the science curriculum at the school, and Kim Morris processes the data at UAF. The ALISON project continues to benefit from the collaboration of Denali employees and Alaska Geographic staff at the Murie Science and Learning Center (MSLC).
Collecting data at Horseshoe Lake
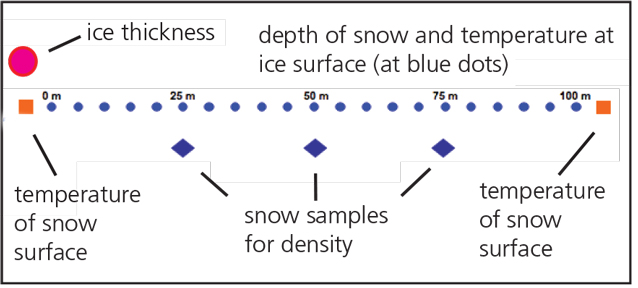
Each fall, when the ice becomes thick enough for safe travel, Denali and MSLC staff set up a 300-foot (100-meter) transect across the lake with 21 wooden stakes spaced 15 feet (5 m) apart (see diagram above). During each trip to the lake (4-12 times each winter), students use snow probes and a digital thermometer to measure snow depth and temperature at the bottom of the snow (on the top of the ice) at each stake. At each end of the transect, they measure the temperature of the snow surface.
Students collect three snow samples for snow density (calculated from volume and weight) to convert to a thermal conductivity value (a measure of insulating ability). Finally, students use a wire circuit gauge to determine ice thickness. Students enter the data into a special spreadsheet.
Horseshoe Lake Findings
Based on data since 2003, the ice thickness increases during the winter until early spring when it starts to melt. The maximum thickness usually occurs in late February and March (about 60 cm or 2 feet). Snow depth averages 4+ inches (11 cm) and snow density averages 12 lbs per cubic foot (200 kg per m3).
Ice thickness is affected by the conductive heat flow from the lake water to the air or from the air to the water. Water can freeze when it has lost sufficient heat. Because the heat from lake water flows through any existing ice, and snow on the ice, the properties of the snow make a big difference to the conductive heat flow. Snow acts as an insulating layer. The heat flow across this insulating layer depends on both the density of the snow (dry, low-density snow conducts less heat) and the temperature difference between the snow surface and the ice surface.
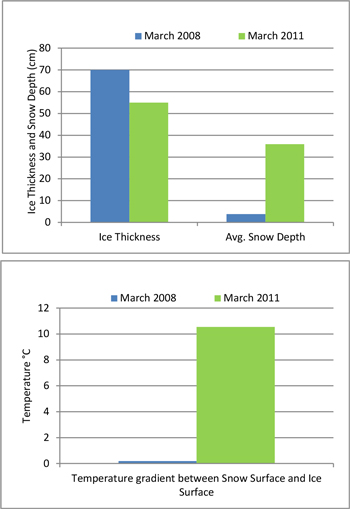
In general, ice does not form as readily when conductive heat flow is less, which occurs when the snow is deeper (more insulation), and the temperature gradient across the snow is greater. For example, by March 2011, snow depth was greater than by March 2008, the temperature gradient across the snow was larger, and thus the ice was thinner (see graphs at right).
NPS Photo
Continuing the ice and snow story
At Horseshoe Lake, despite the best intentions of students to gather data carefully, fluctuating temperatures and strong winds can throw a wild card into the results. One day’s measurements may represent conditions after a warm spell or after the wind has rearranged or compacted the snow on the lake. Non-continuous data may somewhat distort the relationships among ice and snow and climate change that might be more easily discernible from more frequent trips. A trip to the lake captures a “snapshot” of the lake, compared to the larger seasonal or long-term picture of lake snow and ice. Nonetheless, the data collected by the students are valuable for science—and for youthful inquiry.
Before ALISON, few data had been collected about heat flow from small lakes, yet understanding climate change at high latitudes requires knowing how heat flow from such lakes influences the Earth’s heat budget. The statewide ALISON dataset reveals important regional trends in heat flow—higher values in northwestern Alaska and lower values in the interior. Scientists can use these data to validate computer simulations of lake ice-on and ice-off.
Each fall, as Horseshoe Lake freezes, new students will tumble out of a bus to begin their valuable scientific contributions to a lengthening dataset about lake ice and snow.
Last updated: April 21, 2016
