NPS photo
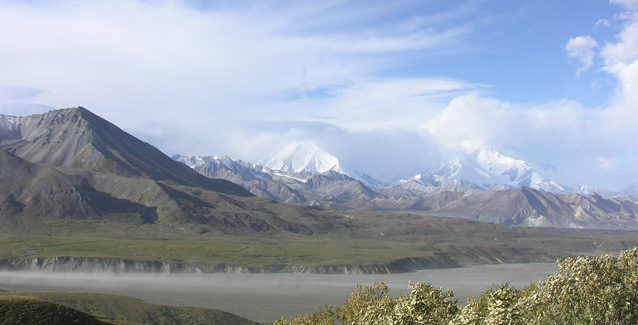
Denali’s air quality is usually among the best in the country, as measured by an air quality monitoring program dating back to 1980. This exceptional record shouldn’t be too surprising, considering the park’s remote location in interior Alaska, far from large-scale industrial activities and densely populated urban areas. What might surprise some people is the fact that small amounts of industrial and agricultural pollutants arrive in Denali from international sources every year.
Remoteness alone cannot protect the park’s clean air in perpetuity. As the global human population continues to grow, it is likely that increasing global emissions might someday reach levels that significantly affect air quality in Denali.

NPS photo
Class I Airshed
Denali is the only national park in Alaska designated as a Class I area—the most protected category— under the Clean Air Act. While Class I status has no regulatory effect on emissions from other continents, it often allows the National Park Service to mitigate the effects of cumulative local and regional emissions. For example, when a new coal-fired power plant was constructed in the town of Healy less than four miles from the park boundary, additional emission control measures were built into the plant’s construction and operating permits to protect air quality and visibility in the park.
Nationwide air quality monitoring
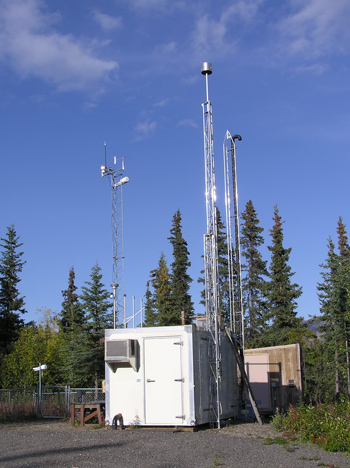
Air quality monitoring in Denali is truly a team effort. Most of the samples are collected through nationwide, interagency air quality monitoring networks, each designed to measure a particular aspect of air quality. Weekly precipitation samples track contaminants related to acid precipitation and deposition. Air is sampled on various types of filters to measure contaminants related to visibility and human health. While these samples are sent to laboratories for analysis, on-site instruments measure ground-level ozone, a primary component of smog.
Every Tuesday, 52 weeks a year, site operators at over 200 sites across the country change precipitation buckets and sample filters, following protocols established by each nationwide monitoring network. Sometimes this means changing a bucket when it’s 30 below zero (-34º C), or changing filters in a downpour with an umbrella in one hand to protect the samples. Network staff pay close attention to data quality, and each network analyzes samples in centralized laboratories to ensure that results can be compared among sites and over time. Because the long-term datasets are accurate and reliable, they become more valuable with each passing decade.

NPS photo
Clean but not pristine
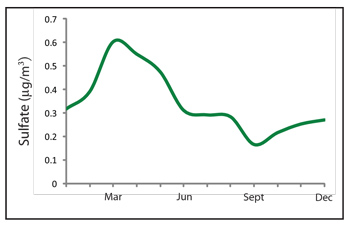
The annual pattern of most airborne contaminant concentrations in Denali shows a summertime low and a peak in the late winter and early spring. These seasonal trends are consistent with known patterns of international contaminant transport directly across the Pacific Ocean, or up and over the Arctic Ocean in a phenomenon called arctic haze. Local and regional sources also contribute to the mix, though as stated above, the total amounts are relatively low.
Some contaminants that occur at very low concentrations in the air are persistent enough to accumulate in park ecosystems over time. Mercury, for example, has been found at higher than expected levels in park fish, though not at concentrations that exceed human health thresholds established by the Alaska Department of Health and Social Services.
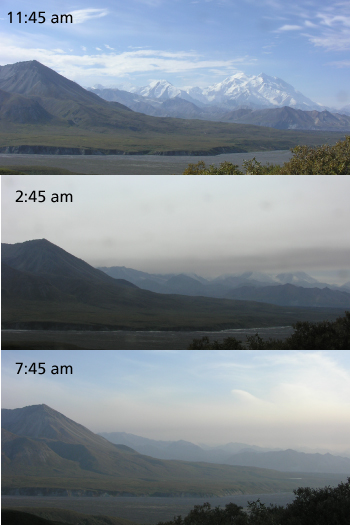
In addition to human-caused emissions detected in the park each year, Denali’s instruments also monitor naturally-occurring events. Smoke from wildland fires is usually the largest contributor to hazy conditions in the park (in Alaska, wildfires are typically caused by lightning strikes). Smoke has been measured from wildfires as far away as Russia and Indonesia, reinforcing the idea that air moves freely around the planet, carrying with it small particles and gasses that have been emitted into the air. In fact, some airborne contaminants may circle the globe a few times before settling out onto the landscape.
Visibility—another look at air quality
In 2004, the Denali air quality monitoring program expanded to include a web camera that looks out over the Alaska Range from the park road corridor. The camera operates during summer only, archiving high resolution photos once every 15 minutes to document visibility conditions. Lower resolution photos are transmitted via satellite to a web site, where the most current view is displayed alongside real-time weather and ozone data. Check out the air quality monitoring webcam to see what's happening in Denali today.

NPS photo
Long-term monitoring
Denali is well known for its wildness and intact ecosystems - a glimpse of the North American continent as it was before the industrial revolution. The air is still clean, but traces of pollution from local, regional and international sources can be found on sample filters from the park. In order to track changes in airborne contaminants over time, including the visible and less noticeable effects on Denali’s ecosystems, air quality has been established as one of the vital signs being monitored by the Central Alaska Inventory and Monitoring Network.
Last updated: June 7, 2016
