Last updated: August 30, 2017
Article
Small-Scale Variations in Melt of a Debris-Covered Glacier: Emmons Glacier, Mount Rainier National Park

Significance
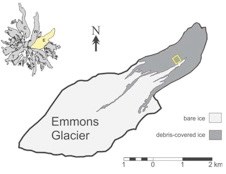
Glaciers can be thought of as giant rivers of ice, transporti ng large volumes of fresh water and sediment while sculpting dramatic topography. Delicate and dynamic systems, glaciers respond to subtle changes in climate conditions, such as melting and retreating under warmer temperatures or growing and advancing as a result of increased precipitation. The health and vitality of mid-latitude glaciers is an important measure of local response to global climate change. In a warming climate, it is increasingly important to monitor the effects of glacier melt in response to stress, such as changes in atmospheric conditions or addition of rock debris to the glacier surface. Melt from Emmons Glacier, located on the northeast slope of the volcano Mount Rainier (Fig. 1), is the source of the White River, an important natural freshwater resource to the region. Glacier melt also provides sediment load eroded from the surface of the volcano to the White River valley, which impacts park infrastructure.

Status and Trends
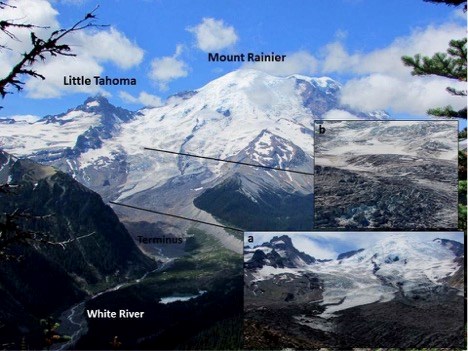
Emmons is the largest glacier in the lower 48 states with a surface area of roughly 4.3 square miles. Annual monitoring of Emmons Glacier by the NPS began in 2000, but its terminus has been mapped periodically since 1913. Although Emmons has retreated from its recorded position in 1913, it is currently one of few glaciers in the Northern Hemisphere that has not been shrinking in the past few decades. Instead, the Emmons terminus has advanced since the 1970’s, likely due to a thick layer of rock debris on the ice surface accumulated, in part, during a rock fall event in 1963 (Granshaw et al., 2014) from Little Tahoma Peak (Fig. 2). Rocky debris covers the lower third of the glacier, which insulates and protects the underlying ice from the heat of the sun even in summer temperatures (Figs. 1, 2). The current study details melt and sediment transport processes on Emmons Glacier to better understand the effect of surface sedimentation and debris mobility on the melt of debris-covered temperate glaciers through modeling.

Methods
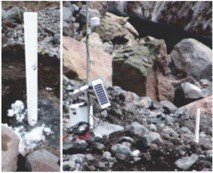
Data collected from Emmons Glacier in August of 2013 provides information on air, surface, and subsurface temperatures, and surface melt of debris- covered glacier ice. Air temperature data was measured using a series of digital sensors, and surface melt, or ablation, data was collected using 16 one meter-long PVC stakes drilled into the ice (Fig. 3) in a 3600 m2 grid (Figure 1), and by measuring the lowering of the ice and debris surface along these stakes. Using these data, a degree-day factor (DDF) (mm/°C/d) is determined following Hock (2003) and compared to existing data from other types of glaciers in different regions (i.e. Braithwaite, 1995; Kayastha et al., 2000; Brook and Paine, 2011).

Results and Discussion
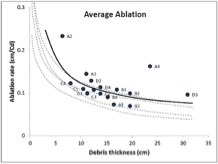
Debris cover plays a critical role in the surficial melt rate of glaciers (i.e. Kayastha et al., 2000). A debris layer of just a few centimeters can enhance ablation because the sun heats the rock and melts the surface, while a thicker debris layer protects the ice surface from the sun and acts like a cooler even in summer weather. Ablation rates vary substantially over distances of just a few meters, and range from 17-44.5 mm/day across these different debris zones in the study site Surface debris thickness ranges 6.3-30.9 cm at the location of the ablation stakes (Fig. 4). The DDF is a measure of the amount of surface ablation relative to debris thickness and exposure of the surface to above- freezing air temperatures. The air temperature at 2m above the debris surface ranged from 4-22°C (39- 72°F), averaging 13°C (56°F), while afternoon debris surface temperatures averaged higher temperatures of roughly 30°C (85°F). Debris temperature varied depending on debris thickness and surface moisture availability, exceeding highs of 44°C (110°F) in dry, boulder-rich zones, drastically different from the 2-m air temperature measurements. Afternoon surface temperatures were as low as 10°C (50°F) in areas of thin (<10 cm), moist, sandy debris. The DDF at Emmons ranges 1.45-4.51 mm/°C/day across all sites with high ablation rates caused by thin debris cover, resulting in some stakes melted out before the study period was complete. Measured ablation rates under debris cover for Emmons are low, but comparable to studies on debris-covered glaciers elsewhere (e.g., Kayastha et al., 2000; Brook and Paine, 2011).
Local variations in slope (0-50°) and aspect of the debris surface affect the intensity of sunshine received at each site. Variations in debris texture (e.g., coarse, porous boulder piles versus mixed sand and gravel) in turn govern how the received solar energy is transferred to the ice, which may account for the spread in data between sites (Fig. 4). For example, some stake sites were located among large boulders and large spaces that left the ice directly exposed to atmospheric conditions like hot summer air temperatures, whereas sandier sediment slowed heat transfer even under smaller debris thickness. Slopes that face the afternoon sun receive more direct heat and melt faster than slopes inclined away from the sun. Faster melt destabilizes debris-covered slopes, forming small hills and ridges.
The bouldery moraine mounds beyond the modern margin of Emmons Glacier are reminiscent of the "dead-ice topography" found along the former edges of Pleistocene ice sheets. The relief of these moraines is thought to arise from uneven distribution of debris on top of slowly melting ice. Studying the debris on active glaciers like Emmons, Winthrop and Carbon can allow us to better interpret the climatological and dynamical clues preserved in the moraines of ancient ice masses.
References
Braithwaite, R. J., 1995. Positive degree-day factors for ablation on the Greenland ice sheet studied by energy-balance modeling: Journal of Glaciology, v. 41, no. 137, p. 153-160.
Brook, M. S., Paine, S., 2011, Ablation of ice-cored moraine in a humid maritime climate: Fox Glacier, New Zealand: Geografiska Annaler: Series A, p. 1-11.
Cuffey, K. M., Paterson, W. S., 2010, The Physics of Glaciers, 4th ed., 693 pp.
Granshaw, F. D., Fountain, A. G., Nylen, T., Samora, B., Swinney, D., Driedger, C., Glaciers of Mount Rainier: Emmons Glacier. http://www.glaciers.pdx.edu/Projects/LearnAboutGlaciers/MRNP/. Accessed on Jan. 10, 2014.
Haidong, H., Yongjin, D., Shiyin, L., 2006, A simple model to estimate ice ablation under a thick debris layer: Journal of Glaciology, v. 52, no. 179, p. 528-537.
Hock, R., 2003, Temperature index melt modeling in mountain areas: Journal of Hydrology, v. 282, p. 104-115.
Kayastha, R. B., Takeuchi, Y., Nakawo, M., Ageta, Y., 2000, Practical prediction of ice melting beneath various thickness of debris cover on Khumbu Glacier, Nepal, using a positive degree- day factor: in Nakawo, M., Fountain, A., and Raymond, C.F., Debris-Covered Glaciers, IAHS workshop publication no. 264, p. 71-81.
