Last updated: April 10, 2020
Article
Weather and Climate in Southwest Alaska
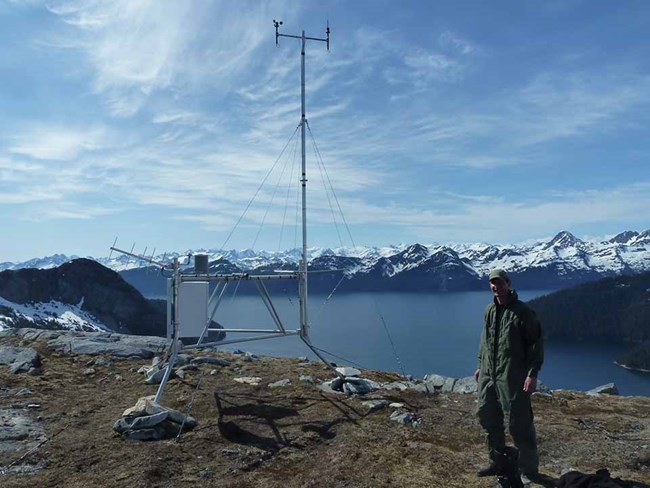
Weather and climate are key physical drivers of ecosystem structure and function. Global climate models indicate that climate change and variability is occurring more rapidly and amplified at higher latitudes. Trends in southwest Alaska’s average annual air temperatures from 1947 to 2019, our longest consistent records, show an increase of 4.9°F at Kenai and 5.1°F at Iliamna over that time period. Monitoring is critical to understanding these changes and how they impact park ecosystems, resources and communities now and in the future.
The Hot, Dry Summer of 2019
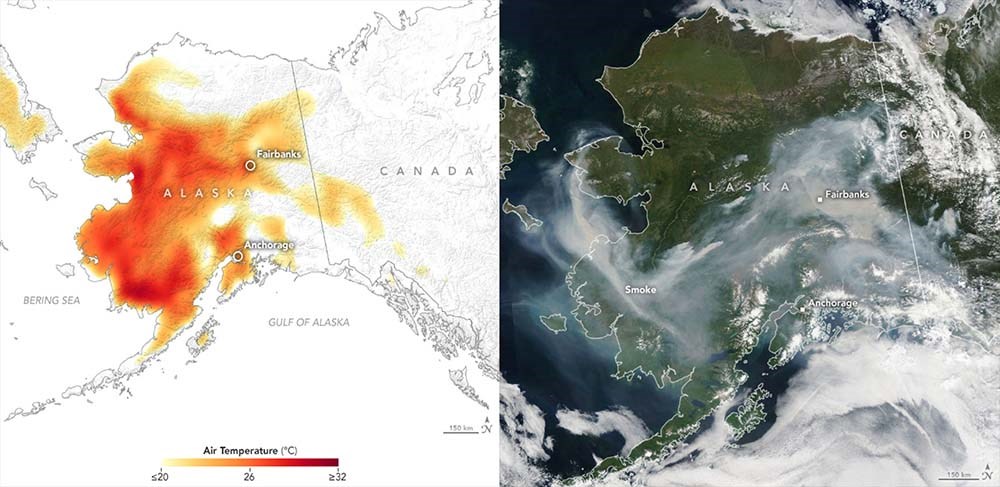
Last summer was exceptionally clear and dry and resulted in record-high temperatures that made for some of the hottest days, weeks, and months ever recorded in many parts of Alaska. The extreme temperatures and drought contributed to an increase in fire activity and the resulting smoke impacted everything from air traffic to human health to park visitation and natural resources in southwest Alaska (Figure 1).
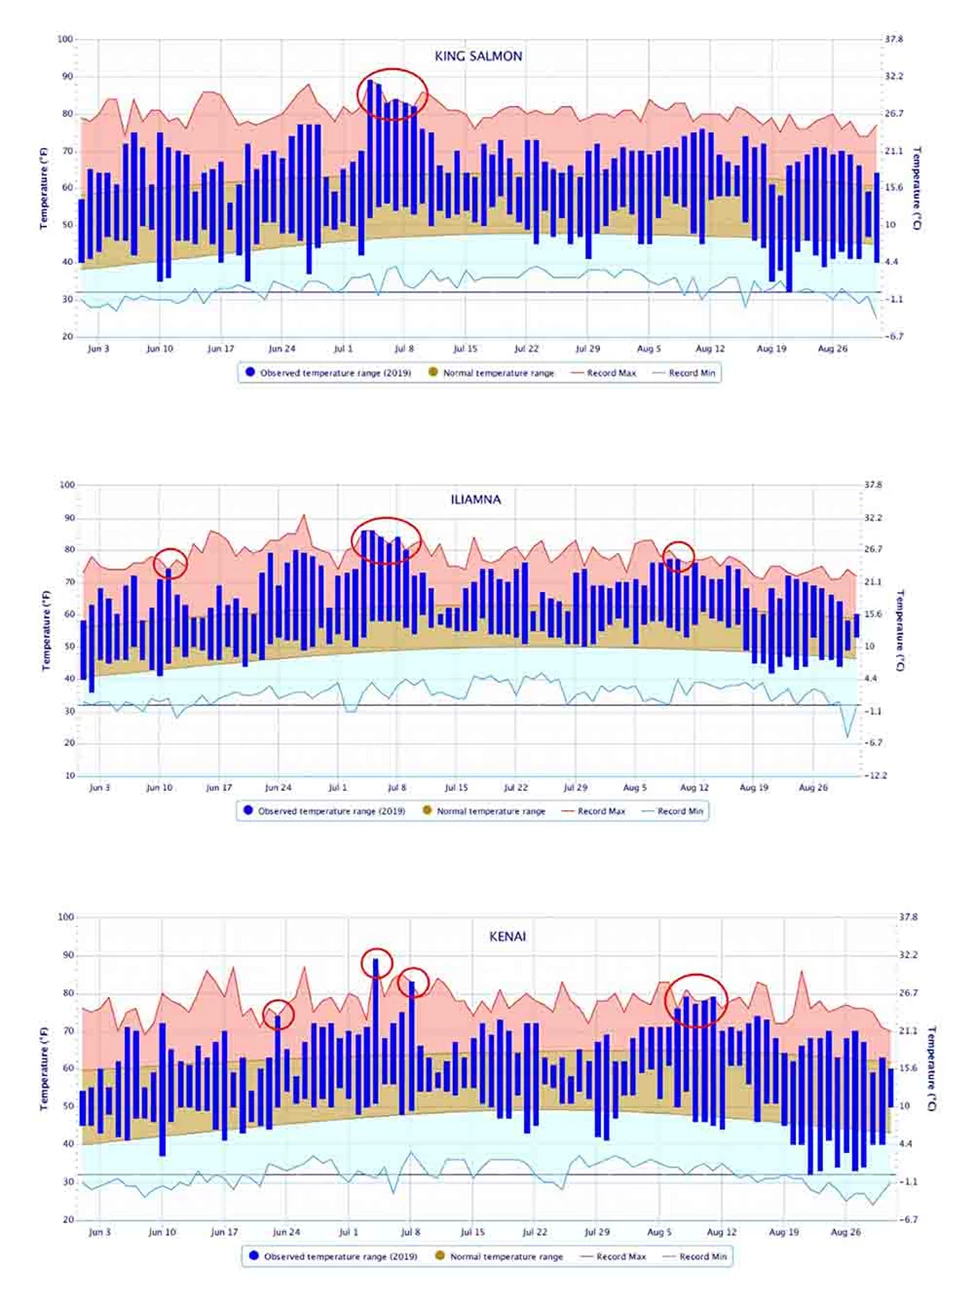
Southwest Alaska parks experienced some of the highest temperatures ever recorded at nearby weather stations operating for 75 years or more (Figure 2). The extreme temperatures increased water temperatures in some rivers and lakes and enhanced the melting of glaciers that in turn contributed to greater runoff and higher water levels in others.
With Heat Came Drought
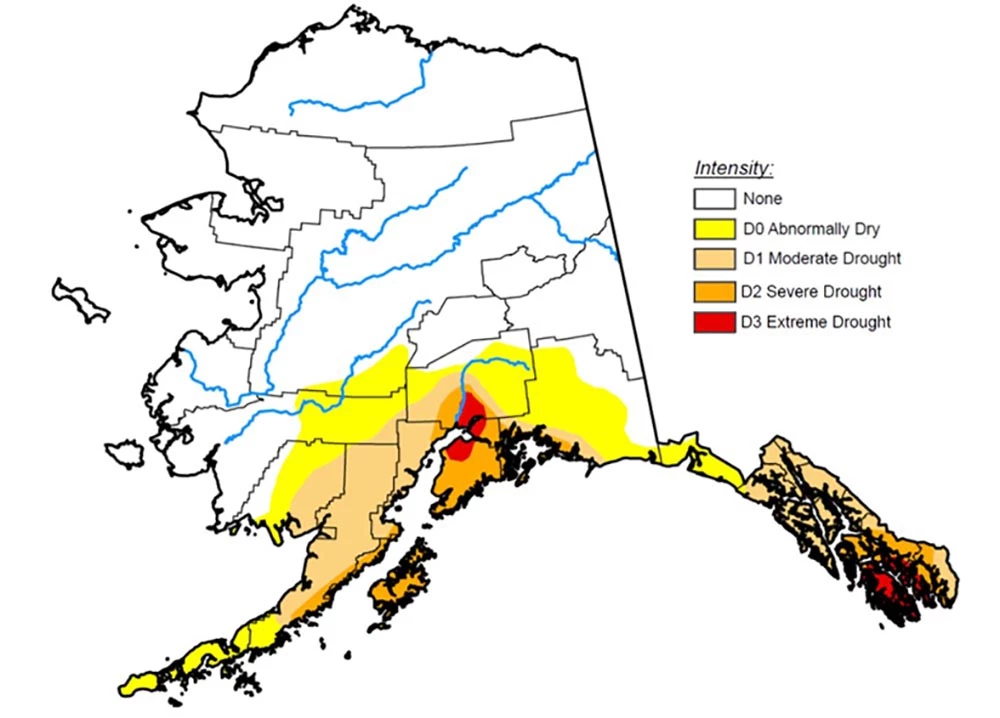
Along with extreme heat there was a lack of precipitation in southwest Alaska. Anchorage recorded its driest (0.04 inch, of normally 3.25 inches precipitation) and warmest August ever (average temperature of 62.6°F, 5.9°F above normal). This resulted in the most severe early September drought indices since the National Weather Service began reporting them for Alaska in 2000 (Figure 3).
The Cold Winter of 2020
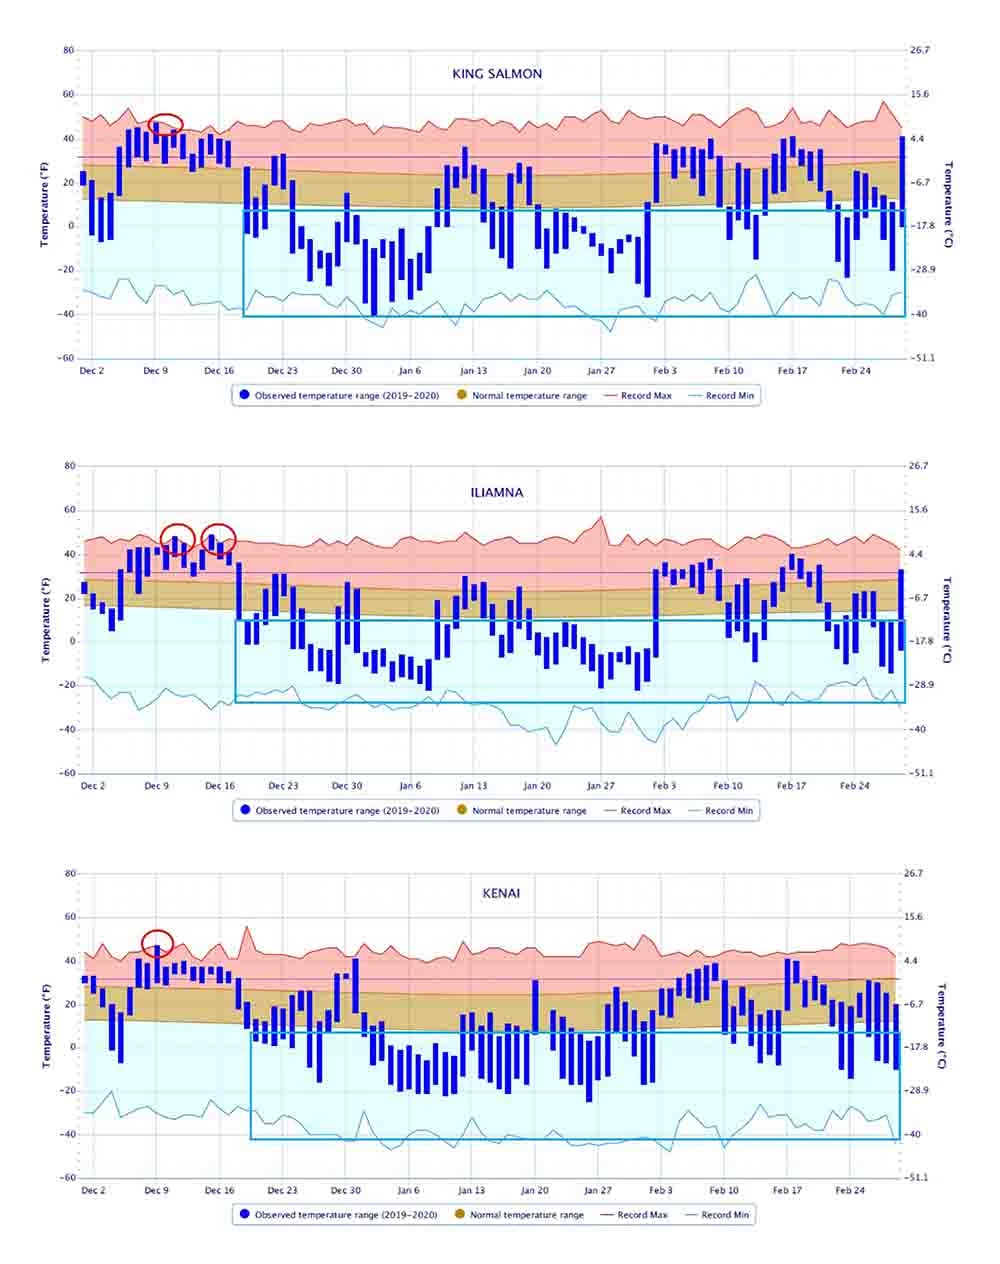
The heat of this past summer may seem like a distant memory after experiencing the sustained, often sub-zero, cold of the past winter. While it may have seemed extremely cold, the statewide temperatures have not been extreme when compared to the long-term climate observations (Figure 4). However, the cold persisted for longer than it has for decades in most of Alaska, which was due to the consistent strong low-pressure circulation over Alaska known as the polar vortex. The polar vortex exhibited less seasonal variation last winter than it has in recent years when it brought Arctic air to the central and eastern US. The variability in the polar vortex and its relationship to climate change is an active area of current research.
What's in Store for Spring and Summer 2020?
Climate predictions for the spring through summer of 2020 show high probabilities for near normal temperatures in April phasing into a warmer-than-average spring and a hot summer across Southwest Alaska.
Discover More about Climate in Alaska's Parks
Real time data from Inventory and Monitoring Network weather stations can be found at:
Western Region Climate Center
Meso West
Check the weather at a specific station around Kenai Fjords National Park.
Quarterly climate predictions from the National Weather Service
Long term climate projections can be found at Scenarios Network for Alaska Arctic Planning
NASA Arctic Sea Ice Minimum
More on the Pacific Decadal Oscillation
More on snow and ice cover can be found at the National Snow and Ice Data Center
