Last updated: August 22, 2017
Article
Climate Monitoring in Mount Rainier National Park

Introduction
Climate can be described as the prevailing weather conditions of a region averaged over a series of years. A region’s climate acts as a “system driver,” an overarching set of ecological and physical phenomena including wind, precipitation, temperature, and other variables associated with the global movements of vast air masses.Climate is a primary factor regulating all biological processes and it ultimately controls the distribution of plant and animal species. For example, climate controls the elevation of treeline, the location of rainforests and all of their associated species. Climate affects the behavior and reproduction of individual organisms. These effects can be subtle, pushing a bird’s breeding season forward or back by days or weeks. Or they can be dramatic, for example through a stream’s temperature above a certain threshold eliminating certain species of fish. In addition, extreme weather, an aspect of a region’s climate, can lead to forest fires, avalanches, and floods.
Mount Rainier National Park (MORA) monitors climate to understand variations in other park resources being monitored. Comparing current and historic data helps us to understand long-term trends and provides the means for modeling impacts to park facilities and resources in the future. The climate monitoring program compiles data from 7 weather stations located inside the park (Figure 1). Compiled weather data for individual water years is published in reports annually.

Status and Trends
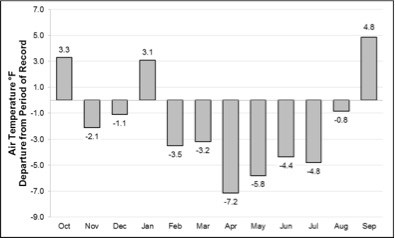
Water years 2010 and 2011 were characterized by cool and wet springs, followed by colder than normal summers. This was particularly true in the spring and summer of 2011. The mean statewide temperature for Washington State from April through July 2011 was the second coldest in a record extending back to 1895. This temperature anomaly is well illustrated when comparing 2011 temperatures at Paradise in MORA, with the nearly 100 year record from this site (Figure 2).
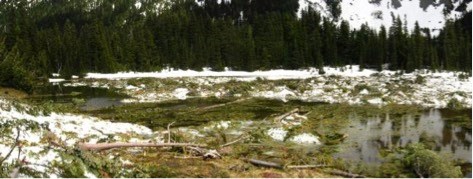
Cold temperatures and above normal precipitation during spring and early summer months of both years also resulted in unusually deep and persistent snowpack. At Paradise, in Mt. Rainier, the record for the maximum snow depth was broken for eight consecutive days beginning on August
7th and ending on August 14th. Snow finally melted at the Paradise COOP location on August 25th, missing the record for latest snow on the ground by two days, which was set in 1974.
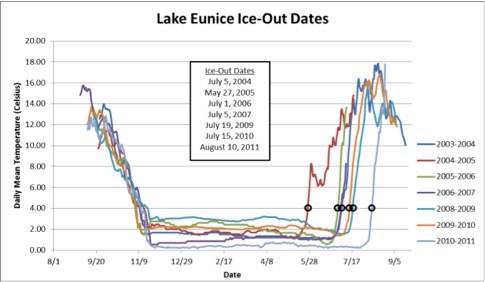
Recent climate trends, especially the cool springs and persistent snowpacks of the last two years, directly influenced the ecosystems and associated studies of those ecosystems within MORA. In 2010 and 2011, Nisqually and Emmons glaciers on Mt. Rainier exhibited positive mass balances for the first time since monitoring began in 2003.

Annual efforts to monitor migratory and resident land birds during spring and early summer of 2011 were stymied by a persistent snowpack blanketing high country areas. At Mount Rainier, field crews were only able to access 13 of the 20 survey transects. The persistent late-summer snowpack also affected MORA elk surveys in August by keeping the elk at lower elevations later in the season. One higher elevation survey found very few elk due to the record August snowpack. Much of the normal summer range was still covered in intermittent snow and spring green-up was just beginning.

Discussion
Climate models project an increase in average temperatures in the Pacific Northwest, while projected changes in precipitation are less certain. In 2010 and 2011, Mount Rainier National Park was largely influenced by the presence of strong La Niña conditions, caused by an atmospheric response to cooler than normal Pacific Ocean temperatures. La Niña conditions are associated with cooler and wetter than normal weather patterns in the Pacific Northwest. The below-normal temperatures of the past two years are simply part of natural climate variation. Future data collections will tell how these trends mesh (or clash) with long-term patterns.
