Last updated: February 3, 2020
Article
Climate Corner, January 2020
NASA and NOAA Report 2019 was Second Hottest Year on Record

NOAA NCEI and NOAA Climate.gov
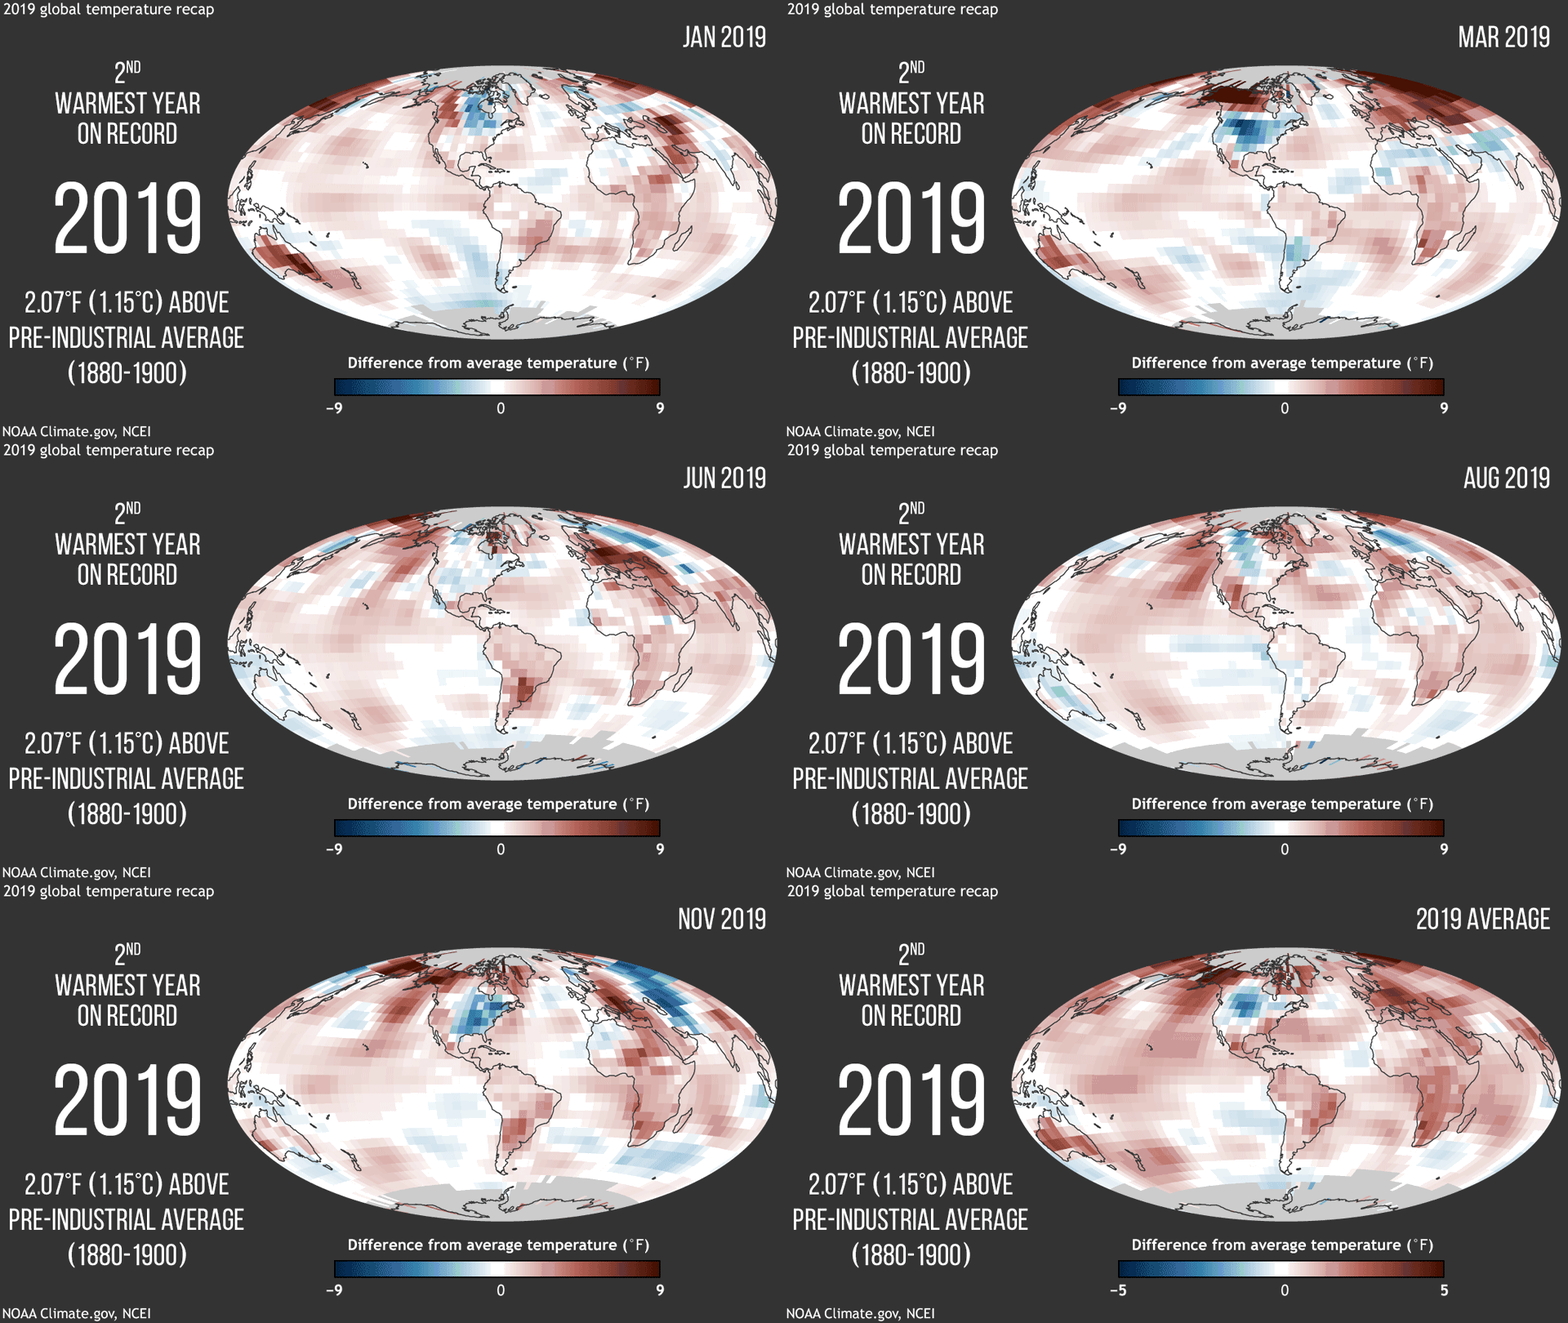
Early this year, experts at NASA and NOAA independently completed reviews of global temperature data collected throughout 2019. Their conclusion: 2019 was the second hottest year since modern record-keeping began in 1880. According to NASA, 2019 global average temperatures were 1.8 degrees Fahrenheit above the 1950-1981 average, and more than 2 degrees F above pre-industrial temperatures. NOAA’s experts used a different model, but came to a similar conclusion: that 2019 temperatures were 1.71 degrees F above the 20th century average. 2019 temperatures were less than one tenth of a degree F cooler than temperatures in 2016, the hottest year on record. These conclusions represent the latest chapter of the robust, long-term warming trend that is being driven by human emissions of carbon dioxide and other greenhouse gases into the atmosphere. Every decade since the 1960s has been warmer than the one before it, with the decade ending in 2019 being no exception. Each of the last five years is one of the top five hottest years on record. 2019 also marks the 43rd year in a row of global temperatures surpassing the 1950-1981 average.
Still, global temperature increases do not impact all parts of the globe equally. Temperatures in the continental United States, for example, were .7 degrees F above the 20th century average in 2019. Meanwhile, Alaska experienced its warmest year ever, with 2019 temperatures that were a staggering 6.2 degrees F above average.
Explore these results, and more, through NOAA and NASA’s graphics-rich slide presentation, or check out NOAA’s or NASA’s press releases on their respective findings.
Ocean Heat Content Reaches Record High

NOAA/NCEI Ocean Climate Laboratory
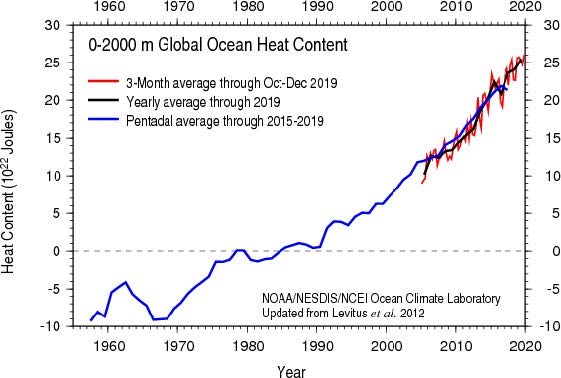
When greenhouse gases prevent excess heat from the sun from escaping into space as easily as it could in the pre-industrial era, that heat must go somewhere else. While a bit of it has remained in our atmosphere, more than 90% of that excess heat has been absorbed by our oceans. Over time, it has accumulated there, causing ocean temperatures to climb. In 2019, according to separate analyses by NOAA and by the Institute of Atmospheric Physics (IAP), ocean heat content (OHC) reached a new record high.
Specifically, OHC describes the amount of heat energy stored in the upper ocean, from the surface down to depths of 2,000 meters. Today, it is measured by a combination of satellites that report the height of the ocean’s surface, and thousands of robotic devices programmed to collect temperature data as they automatically ascend and descend in the ocean. The height of the ocean’s surface is a good proxy for ocean heat content because the ocean expands, and rises, as it warms. OHC is measured in units of energy called Joules or Zeta Joules (ZJ, 1 ZJ=1021 Joules), and in 2019 it was 217 ZJ (NOAA) to 228 ZJ (IAP) above the 1981−2010 average.
Sea surface temperature (SST) is a measure of the temperature just at the very surface of the ocean. The 2019 annual globally averaged SST was also high in 2019. At 1.39 degrees F above the 20th century average, it was the second highest on record.
Learn more about the latest OHC data from the article “Record-Setting Ocean Warmth Continued in 2019,” just published in Advances in Atmospheric Sciences, or learn more about OHC in general from NOAA’s Climate Change: Ocean Heat Content explainer.
