Last updated: August 28, 2019
Article
Cleaner Snow Reveals Cleaner Air in Rocky Mountain Network Parks

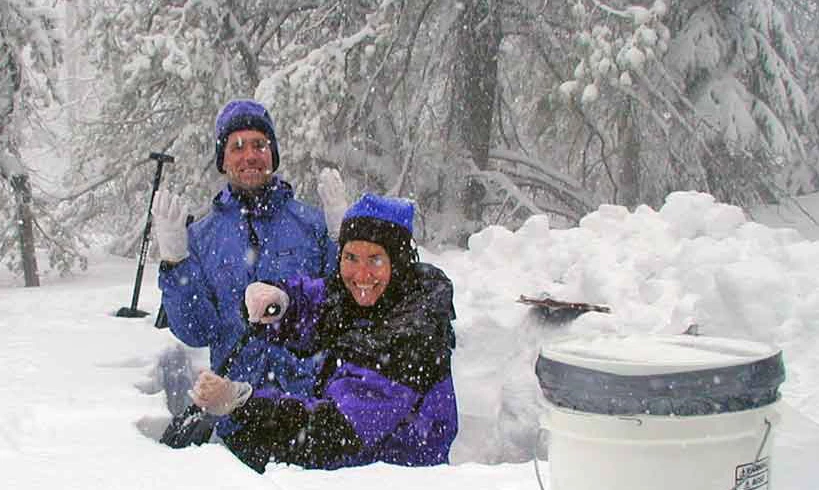
Source: USGS Rocky Mountain Regional Snowpack Chemistry Monitoring.
In a Nutshell
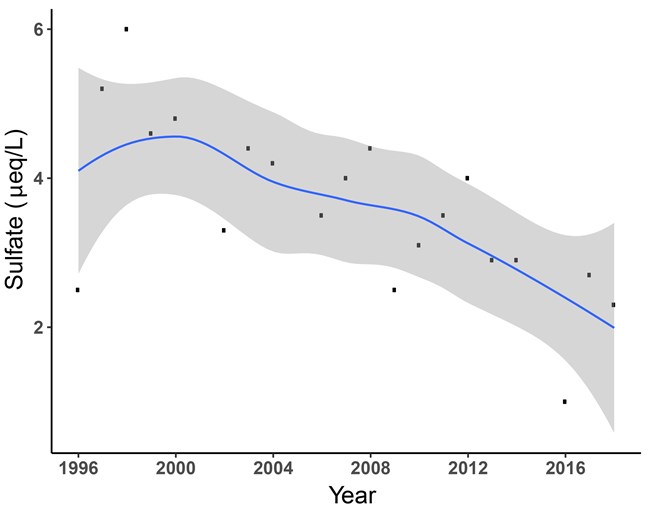
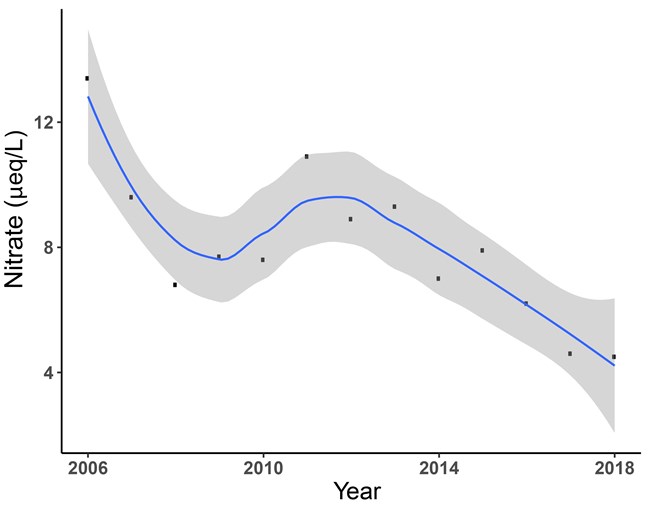
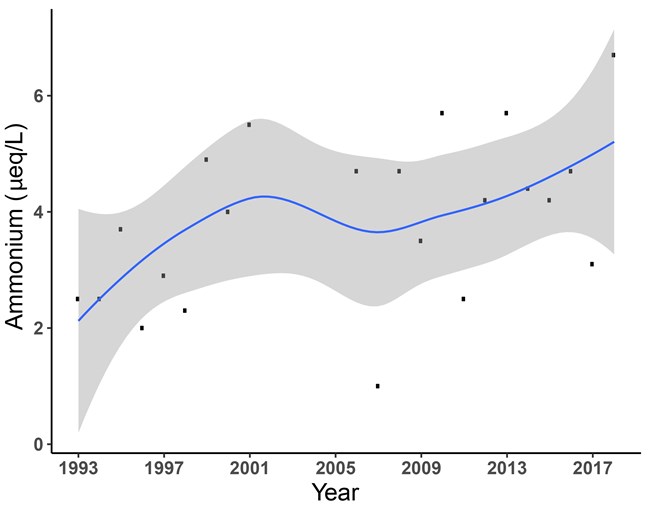
Concentrations of select atmospheric pollutants mostly improved at snow monitoring stations in Glacier National Park, Rocky Mountain National Park, and Great Sand Dunes National Park and Preserve from 1996 to 2018.
Why Monitor Snow?

Source: NPS Rocky Mountain Inventory & Monitoring Network.
National Park Conditions
| Park | Location | Period of Record | Sulfate | Nitrate | Ammonium |
|---|---|---|---|---|---|
| Glacier NP | Apgar Lookout | 1996 - 2018 | Decrease | Stable | Stable |
| Rocky Mountain NP | Lake Irene | 1993 - 2018 | Decrease | Decrease | Increase |
| Rocky Mountain NP | Loch Vale Forest | 1994 - 2018 | Decrease | Decrease | Stable |
| Rocky Mountain NP | Loch Vale Meadow | 1993 - 2018 | Decrease | Decrease | Stable |
| Great Sand Dunes NPP | Music Pass | 2006 - 2018 | Stable | Decrease | Stable |

Source: USGS CO Water Science Center.

Source: USGS CO Water Science Center.

Source: USGS CO Water Science Center.
Mercury sampling began in 2009, and trends will become more apparent as sampling continues.
Rocky Mountain Region Conditions
A regional analysis of snow chemistry from 1993 to 2012 showed similar decreases in sulfate and nitrate concentrations throughout the Rocky Mountains and linked these to improvements in air quality1. In contrast, ammonium concentrations increased regionally during the same time period, although the Northern Rockies subregion, including Glacier National Park, did not show a trend. Ammonium trends were strongest in Wyoming, which is not represented by our park units. It is encouraging that monitoring stations in our national parks continue to show decreases in sulfate and nitrate another 6 years after the regional analysis was completed.
Working towards Clean Air
Park managers can’t control the air or snow, but park monitoring can highlight the success of improving air quality to reduce atmospheric deposition in remote and wild places. All 3 national parks in this project have special protections under the Clean Air Act, passed in the 1970s, to maintain sensitive ecosystems and protect long distance views. The National Park Service cooperates with states, tribes, and other entities to develop strategies for reducing air pollution in parks, like the Rocky Mountain National Park Air Quality Initiative. By working with others, the National Park Service strives to maintain a clean and healthy landscape for visitors to enjoy for years to come.
Learn More
Current data tables and graphs for each station can be found on the USGS website at:
https://www.usgs.gov/centers/co-water/science/rocky-mountain-regional-snowpack-chemistry-monitoring-study?qt-science_center_objects=0#qt-science_center_objects
National Parks and the Clean Air Act:
https://www.nps.gov/subjects/air/cleanairact.htm
Rocky Mountain National Park Air Quality Initiative:
https://www.colorado.gov/pacific/cdphe/rocky-mountain-national-park-initiative
