Last updated: October 1, 2020
Article
Climate Monitoring at Carlsbad Caverns National Park

NPS
What is Climate?
Climate is the meteorological conditions at a given place. A broader time scale (seasons to years) is what distinguishes climate from the instantaneous conditions reflected by the term weather. As the primary driver of ecological processes on earth, climate affects soil-water relationships, plant-soil interactions, plant productivity, cycling of nutrients and water in an ecosystem, and the occurrence and intensity of disturbances.
According to the Köppen Climate Classification System, Carlsbad Caverns National Park has a warm, semi-arid climate. Increasing temperatures due to climate change are a concern at the park and in the region. Chihuahuan Desert ecosystems have a very high natural climate variability making it difficult to detect the effects of climate change in the short run. The Chihuahuan Desert Inventory and Monitoring Network conducts long-term climate monitoring to detect climate changes that could have cascading effects on park ecosystems.

NPS
How Do We Monitor Climate?
A National Oceanic and Atmospheric Administration (NOAA) Cooperative Observer Program (COOP) weather station has been collecting climate data at Carlsbad Caverns National Park since 1935. A Remote Automated Weather Station (RAWS) is also located in the park about three miles from the COOP station and has been in operation since 1997. The stations provide reliable long-term climate daatasets that include maximum and minimum temperatures, precipitation rates, drought indices, and more. We obtain station data from the Climate Analyzer website by water year (October through September).
Water Year 2018 Highlights
(October 2017–September 2018)
Annual precipitation (8.40 inches) was 53% of normal. Normal precipitation is 15.72 inches per year and is based on the 30-year average from 1981 to 2010.
Fall/Winter Rainfall and Temperatures (October–March)
- Rainfall was 2.47 inches total for the fall and winter, which was below the normal of 3.72 inches (66% of normal). November had 0.92 inches of rain (164% of the 0.56-inch normal), which was largely due to a four-day, low-intensity storm that totaled 0.90 inches.
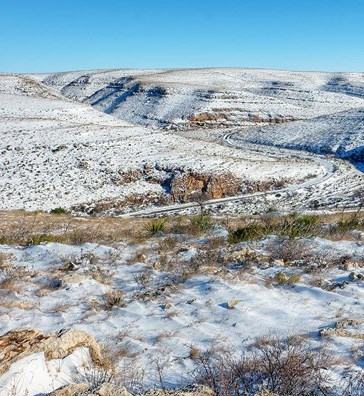
- Cool season temperatures were generally warmer than normal (up to 4.5°F above normal). However, temperatures were slightly cooler than normal in January and February.
Spring/Summer Rainfall and Temperatures (April–September)
- Total spring and summer rainfall was about half of normal at 5.93 inches, though July had four missing data days when the nearby weather station recorded 0.62 inches of rainfall. August received near normal rainfall while other months were substantially less than normal (6%–67% less than normal).
- Warm season temperatures were generally above normal. May was substantially above normal with a mean maximum temperature of 89.5°F (5.8°F above normal) and mean minimum temperature of 65.8°F (6.5°F above normal). By September mean temperatures had cooled slightly.

Graphic generated by climateanalyzer.org (Walking Shadow Ecology).
Drought Index (1981–2018)
The Reconnaissance Drought Index (RDI) provides a measure of drought severity and extent. The drought index for Carlsbad Caverns National Park shows that Water Year 2018 was relatively dry compared to the average from 1981 to 2010.

NPS
Extreme Weather Events
Extreme weather may be as important as long-term climate averages for understanding ecological patterns. High air temperatures are a defining feature of warm deserts. However, extreme heat events can also have important consequences for Chihuahuan Desert and Arizona-New Mexico mountain ecosystems at Carlsbad Caverns National Park. Extreme rainfall events can cause localized flooding and erosion events, increase or decrease plant productivity and flowering, and modify animal behavior.
There were more (28% more) extremely warm days (daily highs over 96°F) at the park in Water Year 2018 than the 30-year normal from 1981 to 2010. Extremely cold days (17 days in Water Year 2018) occurred slightly less than the 30-year normal of 18.9 days. Three days in January 2018 did remain below freezing for the entire 24-hour period. One day (August 19) had extreme rainfall (1 inch or more) compared to an average of 3.3 days (1981–2010).
