Last updated: November 16, 2022
Article
Seasonal Patterns of Mortality in Caribou

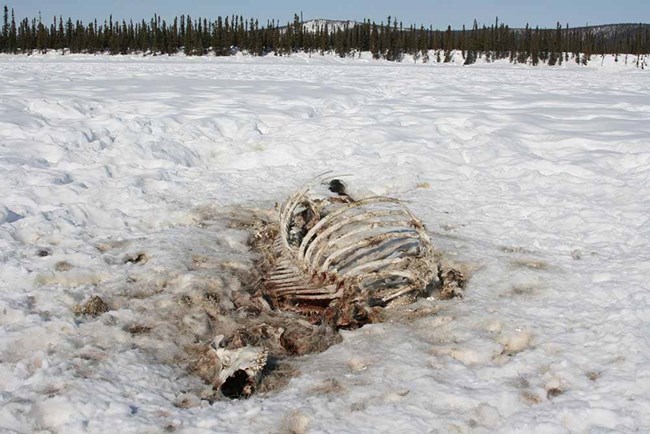
NPS/Kyle Joly
Everything changes with the seasons in the Far North, including the risk of death for wild animals. But unlike the daylight, which is reliably longer in the summer and shorter in the winter, or temperature, which is only slightly less predictable, not nearly as much is known about seasonal survival patterns of animals in the wild. Perhaps more surprisingly, despite the importance of seasonal processes and the importance of survival to ecological studies, no statistical tools exist to readily characterize seasonal patterns of mortality.
In this study, we developed a statistical method that identifies precisely the seasonal aspects of survival. We applied the tool to data collected by NPS biologists on caribou in western Alaska (the Western Arctic Herd) by finding locations where GPS satellite collars have stopped moving. When applied to the Western Arctic Herd caribou mortality, researchers found that in a typical year, there are two distinct “seasons” of mortality risk. The first season ran from April 29 to July 6, peaking June 2 during calving. The second season stretched from September 8 to November 6, peaking on October 7. However, in the late fall of 2017-2018 – a particularly wet and snowy winter – there was an over 2-fold increased risk of mortality, with the seasonal peaks shifted to a later more intense fall season concentrated in the middle two weeks of November, and a longer and similarly higher intensity spring mortality season stretching from late January to mid-May. The causes of higher mortality in 2017-2018 are still unknown, but are likely linked to anomalous climate conditions, which may, however, be increasingly less anomalous.
In both cases, about 75% of the mortality risk was concentrated in the spring season and 25% in the fall mortality season. Perhaps surprisingly, mid-summer and mid-winter were periods of relatively lower mortality risk. In mid-summer, this may be because calves are preferentially targeted by predators, and absorb some of the predation pressure on the adults. The lower mortality of late winter is perhaps more surprising given the severity of winter conditions and difficulty of accessing food, but is ultimately a testament to the amazing adaptations caribou have evolved for surviving in the north – together with relatively lower activity from predators and human hunters.

For everything there is a season: Analyzing periodic mortality patterns with the cyclomort R package.
Abstract
- Many important demographic processes are seasonal, including survival. For many species, mortality risk is significantly higher at certain times of the year than at others, whether because resources are scarce, susceptibility to predators or disease is high, or both. Despite the importance of survival modeling in wildlife sciences, no tools are available to estimate the peak, duration, and relative importance of these “seasons of mortality.”
- We present cyclomort, an R package that estimates the timing, duration and intensity of any number of mortality seasons with reliable confidence intervals. The package includes a model selection approach to determine the number of mortality seasons and to test whether seasons of mortality vary across discrete grouping factors.
- We illustrate the periodic hazard function model and workflow of cyclomort with simulated data. We then estimate mortality seasons of two caribou (Rangifer tarandus) populations that have strikingly different mortality patterns, including different numbers and timing of mortality peaks, and a marked change in one population over time.
- The cyclomort package was developed to estimate mortality seasons for wildlife, but the package can model any time‐to‐event processes with a periodic component.
E. Gurarie, P. Thompson, A. P. Kelly, N. C. Larter, W. F. Fagan, and K. Joly. 2019. For everything there is a season: Analyzing periodic mortality patterns with the cyclomort R package. Methods in Ecology and Evolution doi:10.1111/2041‐210X.13305.
