Last updated: December 14, 2023
Article
Arctic Report Card 2023
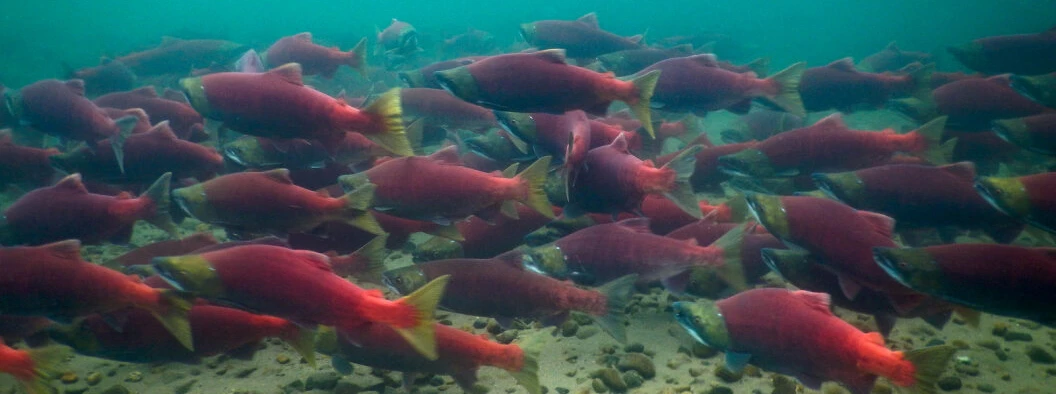
More frequent extreme weather and climate events are transforming the Arctic, yet resiliency and opportunity lie within diverse partnerships.
The Arctic is increasingly warmer, less frozen, and wetter, with regional extremes in weather, climate patterns, and ecosystem responses. Centering locally and internationally focused partnerships, long-term observations, and equitable climate solutions provides Arctic communities and nations as well as society at large with information and mechanisms to cope with a rapidly changing Arctic.
Extreme weather and climate events during the past year in the Arctic and elsewhere have brought unambiguous, climate change-supercharged impacts to people and ecosystems. Such events vary in scale across time and space. In the span of a few hours, individual storms may create hardships and damage that last for years. Longer-term extremes, such as drought or prolonged high temperatures, also have direct, distinct impacts, produce cascading effects in other parts of the environment, and may exacerbate (or mitigate) shorter time frame weather extremes.
The Arctic Report Card also aims to shed light on some of the least understood features of the Arctic environment. In ARC2023, we address the divergent trends of salmon in western Alaska, where Chinook and chum salmon returns are collapsing on the Yukon and Kuskokwim Rivers, while at the same time sockeye salmon in Bristol Bay are at near record high numbers. Both extremes are having severe economic and cultural impacts. Changing environmental conditions clearly are playing a role yet additional work incorporating both Indigenous Knowledge and Western science is needed to understand what is driving these observed trends.
Following are highlights from the 2023 Arctic Report Card. View previous reports.
Surface Air Temperature
Warming near-surface air and upper-ocean temperatures in the Arctic represent an ongoing signature of Arctic change. This regional warming rate exceeds that of the global mean temperature, a phenomenon known as Arctic Amplification. Air temperature warming is associated with changes in the Arctic hydrologic cycle, including increased seasonal precipitation totals and short-term extremes, as well as declines in terrestrial snow, land ice, and sea ice coverage. The increase in Arctic air temperatures is congruent with more frequent extreme air temperature events, which can have detrimental, rapid, and direct biophysical impacts within the Arctic with indirect effects that permeate globally. Thus, Arctic warming has far-reaching long-term consequences beyond the region. READ MORE
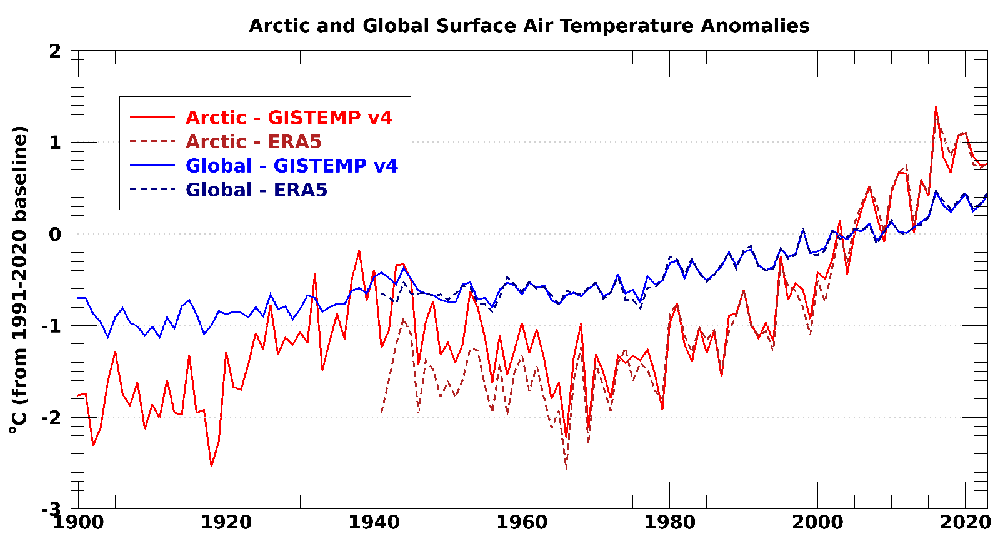
Source: NASA GISTEMP v4 data are obtained from the NASA Goddard Institute for Space Studies and ERA5 data are retrieved from the Copernicus Climate Change Service.
Headlines
- Above-average pan-Arctic (60-90° N) annual surface air temperatures continued in 2023, ranking 6th warmest since 1900.
- The Barents Sea region exhibited above-average surface air temperatures in all seasons, punctuated by large anomalies in autumn 2022 and winter 2023.
- The warmest summer (July-September mean) on record was observed in 2023.
Precipitation
Consistent with Arctic warming, precipitation in the Arctic is increasing. As shown in the 2022 Arctic Report Card and updated here, the increase of pan-Arctic mean precipitation is apparent in all seasons. However, trends in Arctic precipitation vary regionally and interannual variability is large. These variations have important implications for wildfire season severity and for river and lake levels. Warming is also leading to a transition from solid to liquid precipitation in the warmer parts of the Arctic, although the coldest areas of the Arctic are expected to see snowfall increases in the future.
he Arctic experienced notable precipitation anomalies in the 2022/23 water year. The prominent features were (1) a continuation of the trend towards wetter conditions on the pan-Arctic scale, (2) large seasonal anomalies, including a wet winter in parts of Alaska, a dry spring in much of western Eurasia and over the northern North Atlantic, and a dry summer over much of northern Canada, (3) shorter-duration heavy precipitation that broke existing records at various locations within the Arctic. READ MORE
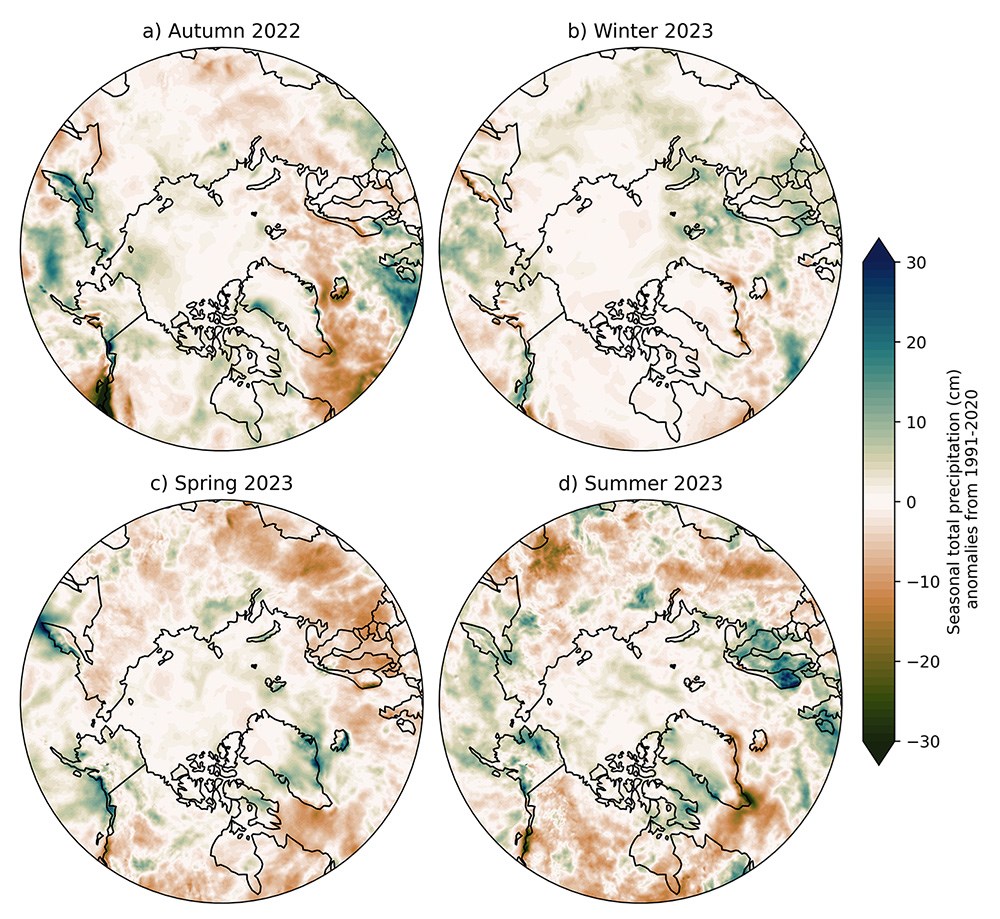
Data source: ERA5 reanalysis.
Headlines
- Pan-Arctic mean precipitation from ERA5 for the 2022/23 water year ranked as sixth highest on record and was modestly above the 1991-2020 average in all seasons.
- Heavy precipitation events broke existing records at various locations across the Arctic.
- Notable regional anomalies during the 2022/23 water year included a wet winter over parts of Alaska, a dry spring over western Eurasia, a dry summer over northern Canada, and record rains in Scandinavia during August.
Terrestrial Snow Cover
Snow accumulation during the 2022/23 winter was above average across both continents, especially Eurasia. This allowed above normal SWE in some regions to persist into May (e.g., central Siberia and Alaska). However, intensive melt during spring across Arctic Canada resulted in a new record low May snow extent for the North American Arctic. Looking historically across Eurasia, the June snow extent values for 11 of the past 14 years represent near complete absence of snow cover across the continent except for residual amounts in higher elevation locations. Compared to historical conditions, this results in approximately two additional weeks of snow-free conditions before July. The more northernly location of the Canadian Arctic Archipelago prevents complete loss of snow extent until after June across the North American sector of the Arctic. READ MORE
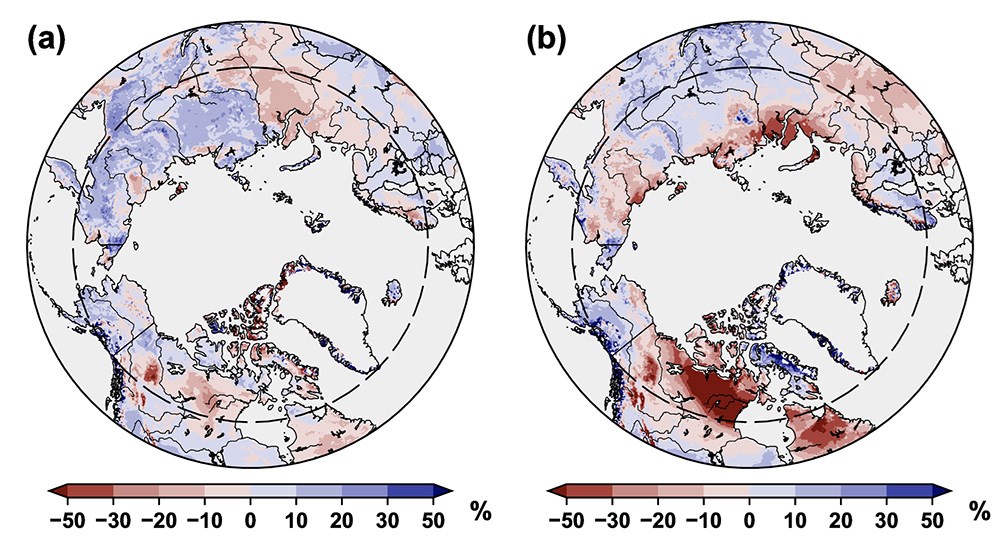
Source: NOAA IMS data record.
Headlines
- North American May snow cover extent set a record low in 2023 (lowest in the 57-year record) associated with high spring temperatures across the Northwest Territories and Nunavut.
- Snow accumulation during the 2022/23 winter was above average across both continents, particularly Eurasia.
- Since 2010, there was a near-complete absence of snow cover in June in Eurasia (except for residual amounts at higher elevations) for 11 of the 14 years; this lack of June snow cover did not occur at all between 1967 and 2009.
Sea Surface Temperatures
Arctic Ocean sea surface temperatures (SSTs) in the summer (June-August) are driven by the amount of incoming solar radiation absorbed by the sea surface and by the flow of warm waters into the Arctic from the North Atlantic and North Pacific Oceans. Solar warming of the Arctic Ocean surface is influenced by sea ice distribution (with greater warming occurring in ice-free regions), cloud cover, and upper-ocean stratification. Discharge of relatively warm Arctic river waters can provide an additional heat source to the surface of marginal seas.
Arctic SST is an essential indicator of the role of the ice-albedo feedback cycle in any given summer sea ice melt season. As the sea ice cover decreases, more incoming solar radiation is absorbed by the darker ocean surface and, in turn, the warmer ocean melts more sea ice. In addition, higher SSTs are associated with delayed autumn freeze-up and increased ocean heat storage throughout the year. Marine ecosystems are also influenced by SSTs, which affect primary production and available habitat. READ MORE
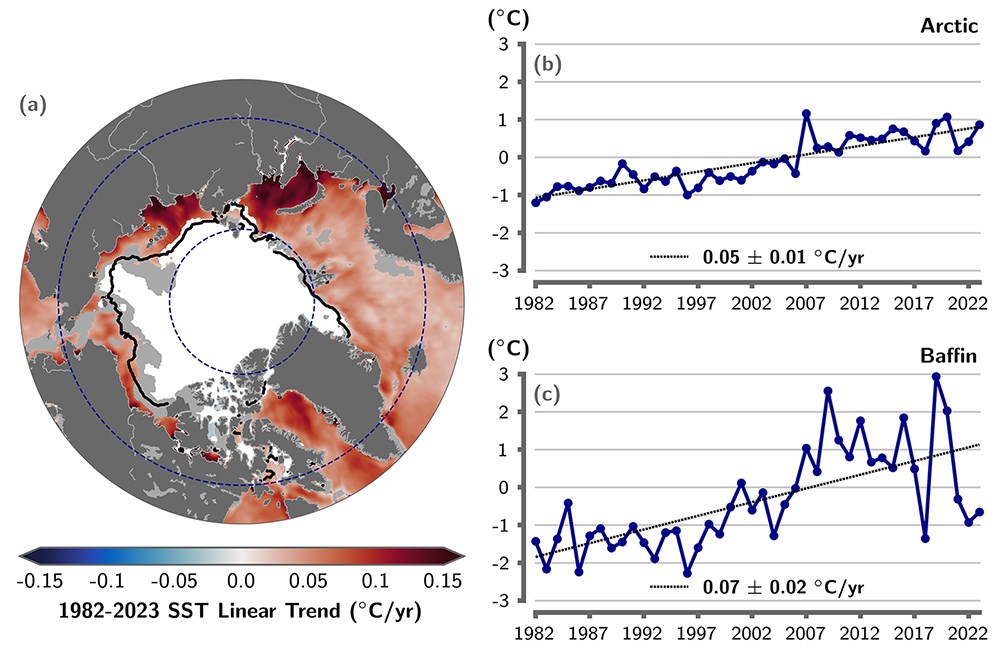
NOAA Optimum Interpolation Sea Surface Temperature (OISST) Version 2.1 product, a blend of in situ and satellite measurements (Reynolds et al. 2002, 2007; Huang et al. 2021).
Headlines
- August 2023 mean sea surface temperatures (SSTs) were ~5-7°C warmer than 1991-2020 August mean values in the Barents, Kara, Laptev and Beaufort Seas.
- Anomalously cool August 2023 SSTs (~1-3°C cooler) were observed in Baffin Bay, the Greenland Sea and parts of the Chukchi Sea.
- August mean SSTs show warming trends for 1982-2023 in almost all Arctic Ocean regions that are ice-free in August, with mean SST increases over regions between 65° N and 80° N of ~0.5°C per decade.
Sea Ice
Arctic sea ice is the frozen interface between the ocean and the atmosphere. It reduces the absorption of solar energy because of its high albedo relative to the darker open ocean surface. In addition, as a physical barrier, it modifies the heat and moisture transfer between the atmosphere and ocean. Sea ice plays a key role in the ecosystem, providing an essential habitat for marine life and modulating the biogeochemical balance of the Arctic. The sea ice cover has long played a practical and cultural role in Indigenous communities of the north. Sea ice historically limited national and corporate activities in the Arctic, but decreased ice cover is influencing commercial transportation, resource extraction, and national security.
The winter 2022/23 freeze-up was typical of recent years with sea ice growth rates near average while the areal coverage remained in the lowest 10% extent (below the lower interdecile range) through the year. Ice growth was particularly slow in the Barents and Kara Seas as well as in the Chukchi Sea, but near normal in other regions. Winter near-surface air temperatures were higher than the 1991-2020 average over most of the Arctic Ocean, particularly in the Barents Sea and portions of the Beaufort Sea. However, lower temperatures prevailed over much of the Eurasian side of the Arctic during spring. Summer temperatures were mixed, with higher-than-average temperatures over the Barents, Kara, Beaufort, and Chukchi Seas and average or slightly below average temperatures elsewhere. READ MORE
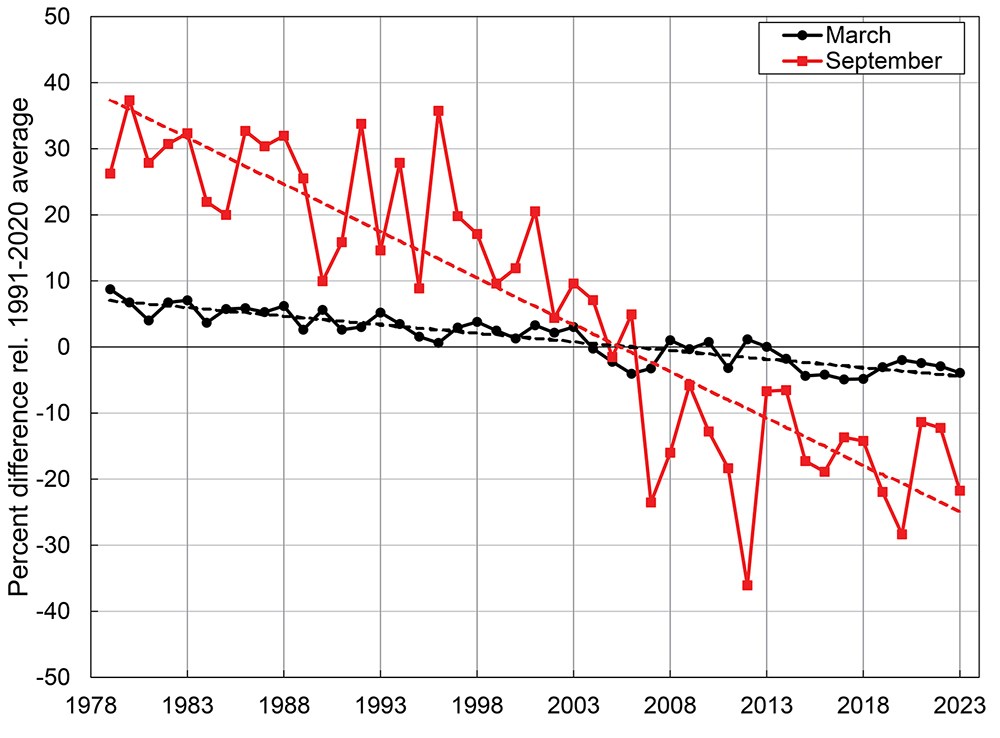
Headlines
- Sea ice extent was 6th lowest in the satellite record (1979 to present) and downward trends continue; the last 17 September extents (2007-23) are the 17 lowest in the record.
- The amount of multiyear ice was largely unchanged from 2022, as multiyear extent remained far lower than in the 1980s, with minimal old ice (>4 years old).
- Average sea ice thickness for the 2022/23 winter was lower than the previous winter, near the 2011-23 average; volume at the end of the 2022/23 winter was the same as the previous year.
Tundra Greenness
Earth’s northernmost continental landmasses and island archipelagos are home to the Arctic tundra biome, a 5.1 million km2 region that forms a “ring” of cold-adapted, treeless vegetation atop the globe, bordered by the Arctic Ocean to the north and the boreal forest biome to the south. The biological and physical conditions of Arctic tundra ecosystems are changing profoundly, as vegetation and underlying permafrost soils are strongly influenced by rising air temperatures and the rapid decline of sea ice on the nearby Arctic Ocean. In the late 1990s, a sharp increase in the productivity of tundra vegetation became evident in global satellite observations, a phenomenon that soon became known as “the greening of the Arctic.” Arctic greening is dynamically linked with Earth’s changing climate, permafrost, seasonal snow, and sea-ice cover, and remains a focus of multi-disciplinary scientific research. READ MORE
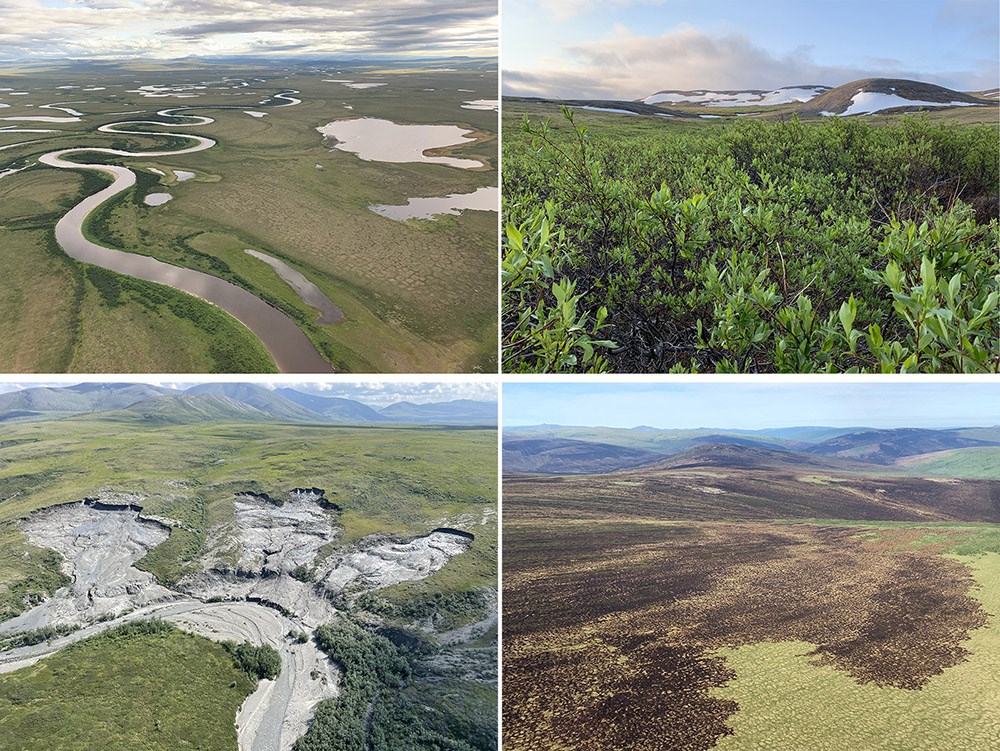
Photos by G. V. Frost (upper row and lower right) and M. J. Lara (lower left).
Headlines
- The circumpolar average peak tundra greenness value in 2023 was the third highest in the 24-year MODIS record, a slight increase from the previous year.
- Peak vegetation greenness in 2023 was much higher than usual in North American tundra, particularly in the Beaufort Sea region, while greenness was relatively low in the Eurasian Arctic, particularly in north-central Siberia and the Russian Far Northeast.
- The eight highest circumpolar tundra greenness values in the long-term satellite record (1982-2022) have all been recorded in the last 12 years, providing unequivocal evidence of Arctic greening.
Divergent Responses of Western Alaska Salmon to a Changing Climate
Pacific salmon populations in western Alaska have responded differently to recent climatic changes, with Chinook salmon (Oncorhynchus tshawytscha) and chum salmon (O. keta) reaching record low abundance levels, while sockeye salmon (O. nerka) have attained record high abundance levels since 2020. Why these species have responded differently has important implications for the future of Pacific salmon in a warming Arctic. Here, we refer to “western Alaska” salmon as those spawning in watersheds that drain into the eastern Bering Sea. Indigenous Peoples in this region, including First Nations communities residing along Canadian tributaries to the Yukon River, have been tied to salmon for at least 12,000 years, while commercial fisheries have been economic mainstays since the late 1800s. Salmon populations in this region have global significance, producing over half of the world’s commercial catch of sockeye salmon from Bristol Bay and have historically supported the world’s largest subsistence fisheries for Chinook and chum salmon in the Yukon and Kuskokwim watersheds. These species, and to a lesser extent, pink (O. gorbuscha) and coho (O. kisutch) salmon, remain a critical source of food, employment and cash income, and cultural practices essential for communities’ well-being and traditional ways of life. We report evidence of these changes primarily through the lens of western science, focusing on a few well-studied stocks, and we acknowledge this essay does not convey the breadth of perspectives or the complexity of ecological changes across the region. READ MORE
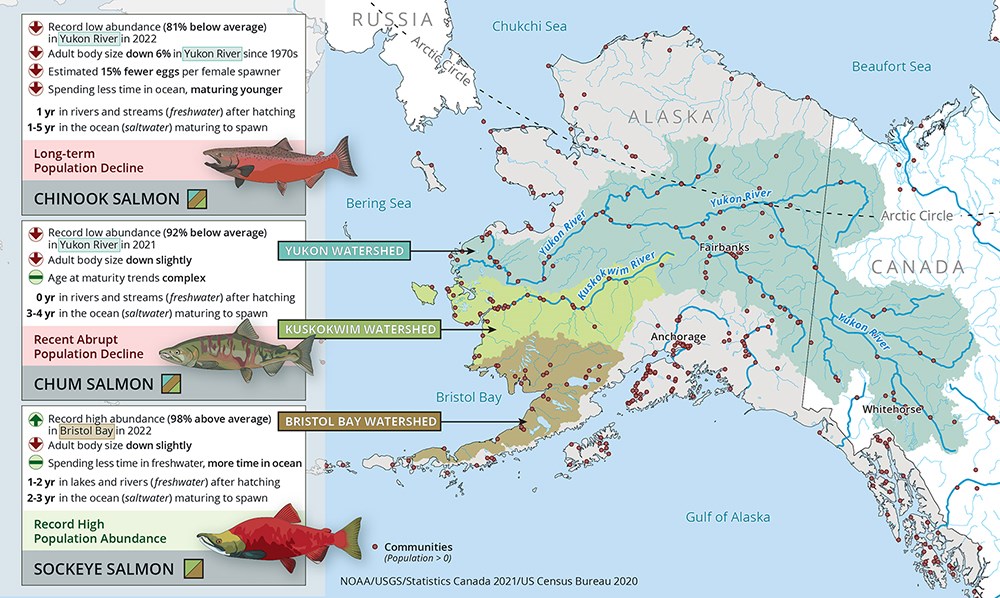
Map and infographic credit: NOAA/Sarah Battle. Salmon illustrations credit: Katie Kobayashi.
Headlines
- Western Alaska salmon abundance reached historic extremes during 2021-22, with record lows for Chinook and chum salmon (81% and 92% below the 30-year mean, respectively) and record highs for sockeye salmon (98% above the 30-year mean).
- Salmon are maturing at smaller sizes. Since the 1970s, for example, Yukon River Chinook salmon have decreased an estimated 6% in mean adult body length and 15% in fecundity, likely exacerbating population declines.
- Salmon population declines have led to fishery closures, worsened user conflicts, and had profound cultural and food security impacts in Indigenous communities that have been tied to salmon for millennia.
- Changes in abundance and size are associated with climatic changes in freshwater and marine ecosystems and competition in the ocean. Changes in predators, food supply, and disease are also likely important drivers.
About the Arctic Report Card 2023
The Arctic Report Card (ARC) has been issued annually since 2006. It is a timely and peer-reviewed source for clear, reliable, and concise environmental information on the current state of different components of the Arctic environmental system relative to historical records. The ARC is intended for a wide audience, including scientists, teachers, students, decision-makers, and the general public.
ARC2023 contains 12 essay contributions prepared by an international team of 82 scientists from 13 countries. An independent peer review of ARC2023 was organized by the Secretariat of the Arctic Monitoring and Assessment Programme (AMAP). ARC is classified as a NOAA Technical Report and is archived within the NOAA Library Institutional Repository.
Thoman, R. L., T. A. Moon, and M. L. Druckenmiller, Eds., 2023: Arctic Report Card 2023, Arctic Report Card 2023.
