Last updated: July 12, 2023
Article
Arctic Report Card 2022
The warming Arctic reveals shifting seasons, widespread disturbances, and the value of diverse observations.
Shifting seasons and climate-driven disturbances, such as wildfires, extreme weather, and unusual wildlife mortality events, are becoming increasingly difficult to assess within the context of what has been previously considered normal.
Few parts of the world demonstrate such extreme seasonal shifts in temperature, land and ocean cover, ecological processes, and wildlife movement and behavior as the Arctic. These extreme shifts across the annual cycle are a source of the Arctic region's heightened sensitivity to climate changes and to climate-related disturbances. The Arctic is also a region of sparse in-situ observations, especially relative to its importance in understanding the Earth's changing climate and associated societal consequences.
Overall, the Arctic Report Card 2022 provides 15 essays highlighting an Arctic in transition. Long-term trends are reinforced by another year of observations, while regional differences across the Arctic are increasingly apparent. The Arctic remains a varied and expansive region to monitor. To understand its transition, local to international partnerships, especially with Arctic Peoples and Indigenous communities, are vital to the use of diverse observations and knowledge, as well as to identifying solutions to long-term climate impacts and abrupt disturbances.
Following are highlights from the 2022 Arctic Report Card. View previous reports.
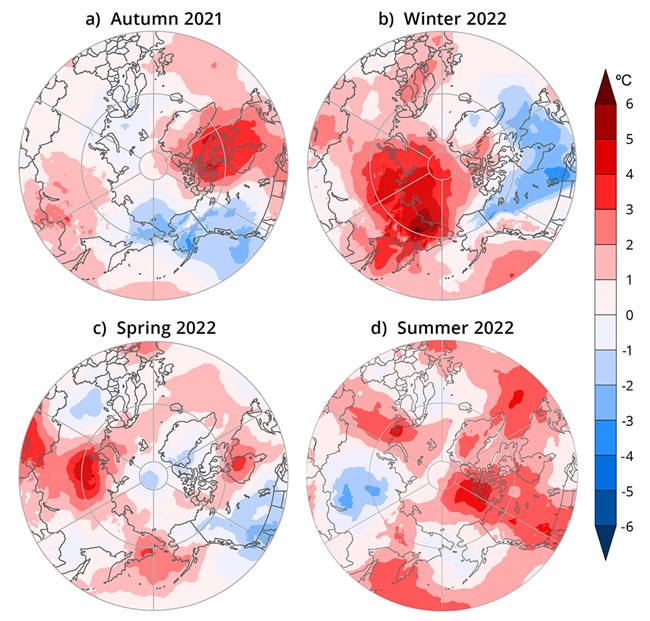
Source: ERA5 reanalysis air temperature data are obtained from the Copernicus Climate Change Service.
Surface Air Temperature
Over recent decades, Arctic air temperatures have warmed at a greater rate relative to global means. This amplified regional warming, known as Arctic Amplification (AA), is associated with various localized land-ocean-sea ice interactions and large-scale atmospheric and oceanic energy transports. AA is a well-established phenomenon that is connected to changes in Arctic weather and climate extremes that impact the region's climate system. Recent research has emphasized that the magnitude of AA is sensitive to multiple constraints, including how the southern limit of the Arctic region is defined, which datasets (i.e., observational versus modeled) are analyzed, and what time periods are considered. New studies showed that land and ocean areas poleward of 60° N have warmed ~2-3 times faster than the global mean during the last three decades.
As a long-standing practice in the Arctic Report Card, this year's Surface Air Temperature essay examines Arctic annual temperatures for northern lands (60-90° N), and includes ocean and total area (land and ocean) temperature estimates across this domain. A summary of seasonal air temperature anomalies is also discussed with an emphasis on patterns observed during the past year. Read more.
Highlights
- Annual water year (October 2021-September 2022) surface air temperatures (north of 60° N) were the sixth warmest dating back to 1900.
- Winter (January-March) 2022 was characterized by above-normal (≥3°C) air temperature anomalies in the Eurasian Arctic and Arctic Ocean contrasted by below-normal (≤-2°C) air temperature anomalies over most of the North American high latitudes.
- An extensive region of low pressure in the eastern Arctic supported warm Eurasian and Arctic Ocean winter temperatures, while low pressure across the Alaska Arctic and northern Canada sustained warm summer temperatures over the Beaufort Sea and Canadian Archipelago.
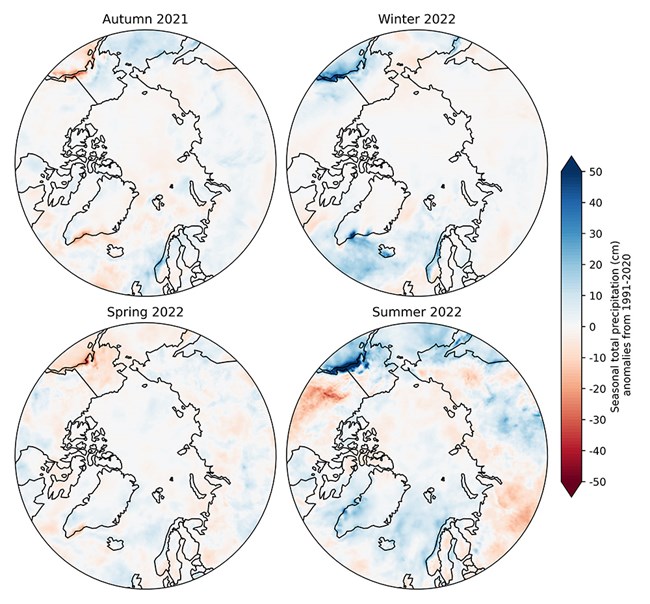
Data source: ERA5 reanalysis.
Precipitation
Globally, precipitation over land has likely increased since 1950, consistent with increases in total atmospheric moisture. Climate models project an increase in Arctic precipitation, a transition from snowfall- to rainfall-dominated climates, and a higher frequency of heavy precipitation events. However, previous assessments of precipitation and precipitation extremes across the Arctic over the period of observations have not shown coherent trends. Results depend on the time period, the region examined, and the data sources (in situ gauge records, satellite retrievals, output from atmospheric reanalysis).
The Arctic experienced notable precipitation anomalies in the 2021/22 water year. The outstanding features were (1) a predominance of positive seasonal departures from the climatological means and (2) shorter-duration heavy precipitation that broke existing records at various locations within the Arctic. Overall, the pan-Arctic (north of 60° N) precipitation for the 2021-22 water year in the ERA5 reanalysis was the 3rd highest since 1950, trailing only the 2019/20 and 2017/18 water years. The Arctic autumn, winter, and summer all ranked among the 10 wettest of their corresponding seasons in the post-1950 period. Read more.
Highlights
- Wetter-than-normal conditions predominated over much of the Arctic during the October 2021 through September 2022 water year, which was the 3rd wettest of the past 72 years.
- A significant increase in Arctic precipitation since the mid-20th century is now detectable across seasons and datasets.
- Significant increases in heavy precipitation events are detectable in the North Atlantic subarctic, while much of the central Arctic shows increases in consecutive wet days and decreases in consecutive dry days.
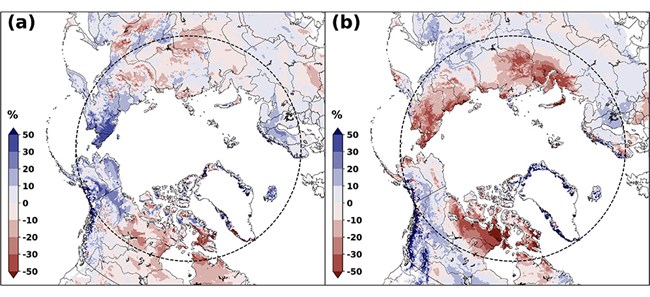
The dashed circle marks the latitude 60° N; land north of this defines Arctic land areas considered in this study. Source: NOAA IMS data record.
Terrestrial Snow Cover
Many components of the Arctic land surface are directly influenced by snow cover from fall through spring, including the surface energy budget, ground thermal regime, permafrost, and terrestrial and freshwater ecosystems. Even following the snow cover season, the influence of spring snow melt timing persists through impacts on river discharge timing and magnitude, surface water, soil moisture, vegetation phenology, and fire risk. Read more.
Highlights
- June Arctic snow cover extent (SCE) anomalies were strongly negative over both North America (2nd lowest in the 56-year record) and Eurasia (3rd lowest in the record).
- The 2021/22 Arctic snow season saw a combination of above-average snow accumulation but early snow melt consistent with the expected changes to snow cover in a warmer Arctic.
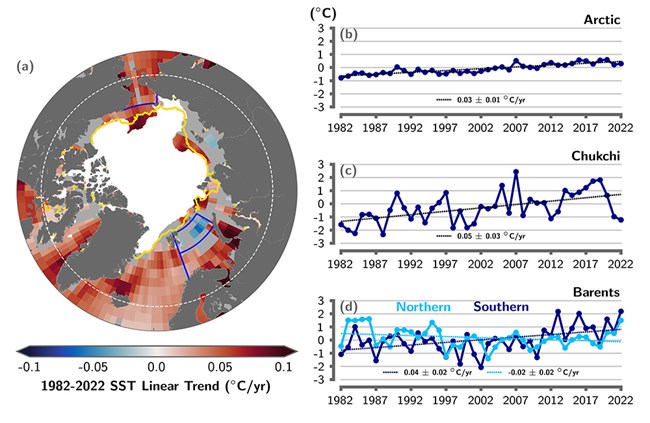
The dotted lines show the linear SST anomaly trends over the period shown and trends in °C/yr (with 95% confidence intervals) are indicated on the plots.
Sea Surface Temperatures
Arctic Ocean sea surface temperatures (SSTs) in the summer (June-August) are driven by the amount of incoming solar radiation absorbed by the sea surface and by the flow of warm waters into the Arctic from the North Atlantic and North Pacific Oceans. Solar warming of the Arctic Ocean surface is influenced by the distribution of sea ice (with greater warming occurring in ice-free regions), cloud cover, and upper-ocean stratification. Discharge of relatively warm Arctic river waters can provide an additional source of heat to the surface of marginal seas.
Arctic SST is an essential indicator of the role of the ice-albedo feedback cycle in any given summer sea ice melt season. As the area of sea ice cover decreases, more incoming solar radiation is absorbed by the darker ocean surface and, in turn, the warmer ocean melts more sea ice. In addition, higher SSTs are associated with delayed autumn freeze-up and increased ocean heat storage throughout the year. Marine ecosystems are also influenced by SSTs, which affect the timing and development of production cycles (see essay Primary Productivity), as well as available habitat. Read more.
Highlights
- August 2022 mean sea surface temperatures (SSTs) were ~2-3°C warmer than 1991-2020 August mean values in the Barents and Laptev Seas.
- Anomalously cool August 2022 SSTs (~3°C cooler) were observed in the Chukchi Sea.
- August mean SSTs show warming trends for 1982-2022 in most regions of the Arctic Ocean that are ice-free in August, with the northern Barents Sea being a notable exception.
Sea Ice
As the frozen interface between the ocean and atmosphere, sea ice plays a key role in the Earth's climate and polar ecosystems. Over the Arctic Ocean, surface albedo (the fraction of the sun's energy reflected by the surface) is increased by the presence of sea ice and its overlying snow cover, which reduces the absorption of solar radiation and seasonal warming. Sea ice also serves as a platform and interface for marine life and influences the biogeochemical balance of the Arctic. Sea ice in the Arctic has long played a practical and cultural role in Indigenous communities of the north and is increasingly influencing modern commercial transportation, resource extraction, and national security.
After the September 2021 minimum extent, sea ice growth followed a fairly typical pattern, with slower than average freeze-up in the more southerly Hudson and Baffin Bays and near-normal growth elsewhere. Winter and spring near-surface air temperatures over the Central Arctic were well above the 1991-2020 average, particularly in the Beaufort Sea where temperatures were 7°C (13°F) above average in March. However, temperatures reverted back to near-normal values in May. During the June to August summer, temperatures were again higher than average in the Beaufort, but lower than average on the Atlantic side of the Arctic (see essay Surface Air Temperature). Read more.
Highlights
- Arctic sea ice extent was similar to 2021 values, higher than many recent years, but much lower than the long-term average.
- Open water areas developed near the North Pole through much of the summer, making the area easier to access for polar class tourist and research vessels; both the Northern Sea Route and Northwest Passage largely opened.
- Multiyear ice extent and sea ice thickness and volume rebounded after near-record low levels in 2021, but were still well-below conditions in the 1980s and 1990s, and the oldest ice continued to be extremely scarce.
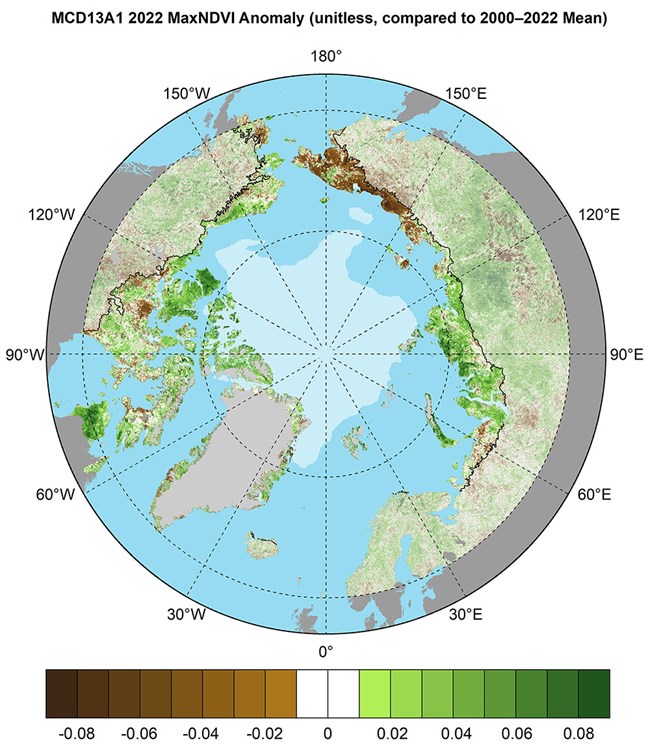
MODIS MCD13A1 v6.1 dataset.
Tundra Greenness
Earth's northernmost continental landmasses and island archipelagos are home to the Arctic tundra biome, a 5.1 million km2 region characterized by low-growing, treeless vegetation. The tundra biome forms a "ring" of cold-adapted vegetation atop the globe, bordered by the Arctic Ocean to the north and the boreal forest biome to the south. The biological, physical, and climatic conditions of Arctic tundra ecosystems are changing profoundly, as vegetation and underlying permafrost soils are strongly influenced by warming air temperatures and the rapid decline of sea ice on the nearby Arctic Ocean (see essays Surface Air Temperature and Sea Ice). In the late 1990s, a sharp increase in the productivity of tundra vegetation became evident in global satellite observations, a phenomenon that has come to be known as "the greening of the Arctic." Arctic greening is dynamically linked with Earth's changing climate, permafrost, seasonal snow, and sea-ice cover, and continues to be a subject of multi-disciplinary scientific research. Read more.
Highlights
- The circumpolar average peak tundra greenness value in 2022 declined from the record high values of the previous two years, but still represented the fourth highest value since 2000.
- Tundra greenness in 2022 was high in most of the North American Arctic, but unusually low in northeastern Siberia, consistent with persistent summer sea-ice in the adjacent Chukchi Sea.
- Wildfires, extreme weather events, and other disturbances have become more frequent, highlighting components of Arctic change that drive increased regional variability in tundra greenness.
About the Arctic Report Card 2022
The Arctic Report Card (ARC) has been issued annually since 2006. It is a timely and peer-reviewed source for clear, reliable, and concise environmental information on the current state of different components of the Arctic environmental system relative to historical records. The ARC is intended for a wide audience, including scientists, teachers, students, decision-makers, and the general public.
ARC2022 contains 15 essay contributions prepared by an international team of 147 authors from 11 different countries. An independent peer review of ARC2022 was organized by the Secretariat of the Arctic Monitoring and Assessment Programme (AMAP). ARC is classified as a NOAA Technical Report and is archived within the NOAA Library Institutional Repository.
Druckenmiller, M. L., R. L. Thoman, and T. A. Moon, Eds., 2022: Arctic Report Card 2022, Arctic Report Card 2022.
