Last updated: January 2, 2020
Article
Arctic Report Card 2019
Arctic ecosystems and communities are increasingly at risk due to continued warming and declining sea ice.
The Arctic marine ecosystem and the communities that depend upon it continue to experience unprecedented changes as a result of warming air temperatures, declining sea ice, and warming waters. Arctic Report Card 2019 draws particular attention to the Bering Sea region, where declining winter sea ice exemplifies the potential for sudden and extreme change. Indigenous Elders from the Bering Sea region offer their experiences of living at the forefront of climate change.
Following are highlights from the 2019 Arctic Report Card. View previous reports.
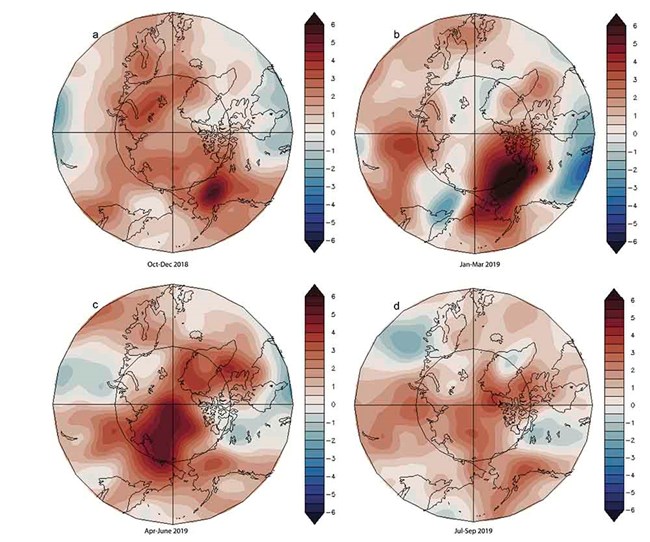
Data accessed from NOAA/ESRL, Boulder, CO, at https://www.esrl.noaa.gov/psd/.
Surface Air Temperature
Arctic surface air temperature is an indicator of both regional and global climate change. Although there are year-to-year and regional differences in air temperatures driven by natural variability, the magnitude, year-to-year persistence, and Arctic-wide character of recent temperature increases is a major indicator of global climate change and the concentration of atmospheric greenhouse gases (Overland, 2009; Notz and Stroeve, 2016). Warming atmospheric temperatures also act as the driver of broader Arctic change in the terrestrial and ocean spheres. A linear relationship between global temperature change and Arctic sea ice area decline and suggest direct forcing (Mahlstein and Knutti, 2012). Tundra and glacier responses also appear as forced changes from temperature increases. We report on the spatial and temporal variability of Arctic air temperatures during the period October 2017 through September 2018, the 12-month period since the end of the previous reporting period in Arctic Report Card 2017. Read more.
Highlights
- The average annual surface air temperature over land north of 60° N for October 2017-September 2018 was the second warmest (after 2015-16) in the observational record beginning in 1900. Arctic temperatures for the past five years (2014-18) all exceed previous records.
- Arctic air temperature continues to increase at double the rate of the global mean air temperature increase.
- Relatively warm autumn, winter and spring months were related to an influx of heat and moisture from the subarctic, facilitated by north-south wavy jet stream patterns.
- During summer, neutral temperature anomalies occurred across the central Arctic Ocean and, like summer 2016 and 2017, did not support rapid summer sea ice and ice sheet loss.
Terrestrial Snow Cover
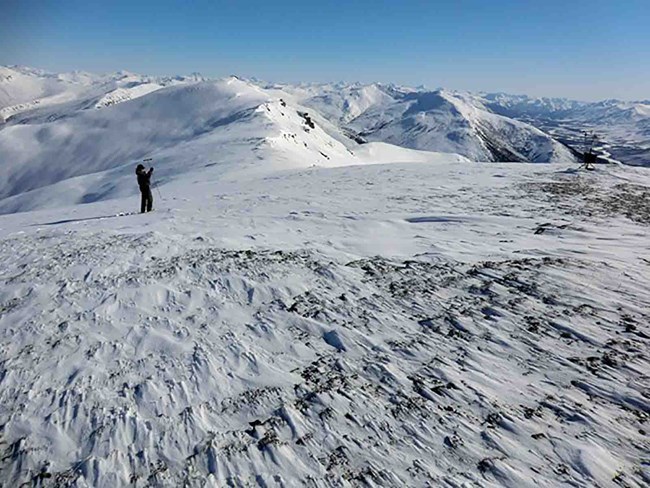
Snow covers the Arctic land surface (land areas north of 60° N) for up to 9 months each year, and influences the surface energy budget, ground thermal regime, and freshwater budget of the Arctic (Brown et al. 2017). Snow also interacts with vegetation, affects biogeochemical activity, and influences migration and access to forage for wildlife, which impacts terrestrial and aquatic ecosystems (Callaghan et al. 2011). The assessment provided here is based on an ensemble of datasets derived from satellite observations and reconstructions of snow cover from snowpack models driven by atmospheric reanalyses. Collectively, this basis provides a consistent picture of Arctic snow cover variability over the last five decades.
Snow across the Arctic land surface can be characterized by three variables: how much area is covered by snow (snow cover extent - SCE), how long snow continuously remains on the land surface (snow cover duration - SCD), and how much water is stored in solid form by the snowpack (a function of the snow depth and density, commonly expressed as snow water equivalent - SWE). We examine each of these variables in turn for the 2018/19 Arctic snow season. Read more.
Highlights
- After two years of above or near-average anomalies, the 2019 spring saw a return to below-average Arctic snow cover extent (SCE) anomalies, which were predominant over the 2005-16 time period. North American Arctic SCE anomalies in May and June were the 5th and 3rd lowest, respectively, in the 53-year record.
- Long-term trends for SCE remain negative across the Arctic: -3.4%/decade and -15.2%/decade for May and June, respectively (1981-2019).
- Exceptionally early snow melt occurred in March over the northwestern Canadian Arctic and Alaska, contributing to below-average April snow water equivalent and snow depth. Earlier than normal snow melt also occurred across the eastern Canadian Arctic driven by warm temperature anomalies.
- Winter season snow accumulation was near normal over Eurasia.
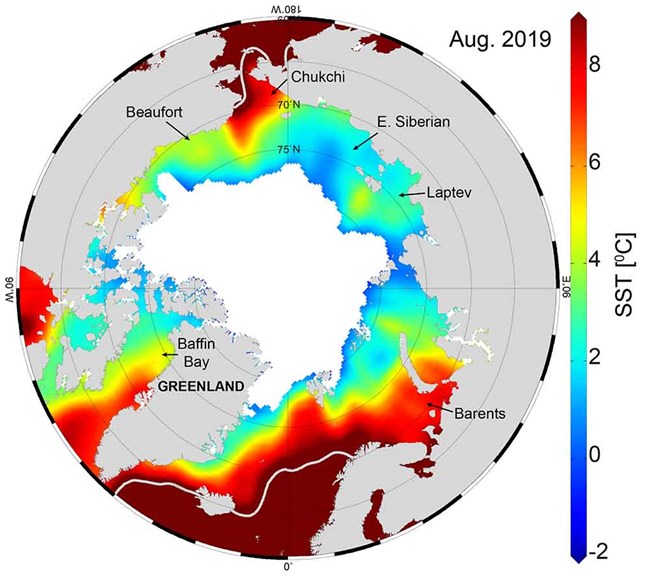
Sources: SST data are from the NOAA OISSTv2; sea-ice extent data are from NSIDC Sea Ice Index, Version 3, Fetterer et al. 2017.
Sea Surface Temperatures
Summer sea surface temperatures (SST) in the Arctic Ocean are driven mainly by the amount of incoming solar radiation absorbed by the sea surface. Solar warming of the Arctic surface ocean is influenced by the distribution of sea ice (with greater warming occurring in ice-free regions), cloud cover, ocean optical properties, and upper-ocean stratification. In the Barents and Chukchi Seas, there is an additional source of ocean heat contributed by the advection of warm water from the North Atlantic and North Pacific Oceans, respectively. Arctic SSTs are an essential indicator of the role of the ice-albedo feedback mechanism in any given summer melt season. As the area of sea-ice cover decreases, more incoming solar radiation is absorbed by the ocean and, in turn, the warmer ocean melts more sea ice. In addition, marine ecosystems are influenced by SST, which affects the timing and development of primary and secondary production cycles as well as available habitat for individual species (see essay Arctic Ocean Primary Productivity). Read more.
Highlights
- August mean sea surface temperatures (SSTs) in 2019 were ~1-7°C warmer than the 1982-2010 August mean in the Beaufort, Chukchi, and Laptev Seas and Baffin Bay, and ~0.5-2°C cooler in the Barents Sea region.
- August mean SSTs show statistically significant warming trends for 1982-2019 in most regions of the Arctic Ocean that are ice-free in August.
- Northern Barents Sea August mean SSTs show statistically significant cooling trends for 1982-2019.
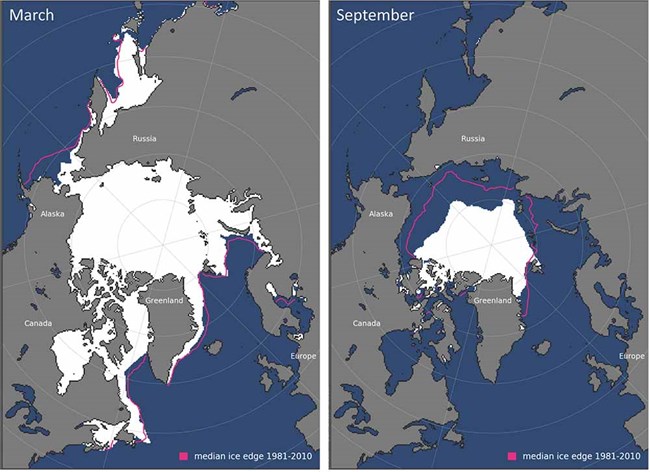
Maps are from NSIDC at http://nsidc.org/data/seaice_index/
Sea Ice
Sea ice is an important element of the Arctic system because it (1) acts as a barrier between the underlying ocean and the atmosphere, (2) limits the amount of absorbed solar energy during the summer due to its high albedo, (3) provides a habitat for biological activity, (4) limits human access to the Arctic Ocean, and (5) serves as a platform for Indigenous community hunting and travel. Arctic sea ice cover varies substantially during the year, with end-of-winter ice cover generally being two to three times as large as at the end of summer. Sea ice extent has been continuously monitored by passive microwave instruments on satellite platforms since 1979, providing a consistent long-term perspective on changing coverage over the last four decades.
The sea ice extent estimates used here are based on products from the National Snow and Ice Data Center (NSIDC) Sea Ice Index (Fetterer et al. 2017), derived from NASA gridded sea ice concentration fields (Cavalieri et al. 1996; Maslanik and Stroeve 1999). Other similar products exist and, while absolute numbers vary, they all show general consistency in trends and variability.
The months of March and September are of particular interest in sea ice time series because they represent typical Arctic sea ice maximum and minimum extents, respectively. Figure 1 shows monthly average ice extents in March and September 2019. The sea ice cover reached a winter maximum extent of 14.78 million km2 on 13 March 2019. This was tied with 2007 as the 7th lowest maximum extent in the 41-year satellite record and was 5.9% below the 1981-2010 average. The previous four years (2015-18) are the four lowest years in the record. However, these losses are not evenly distributed, with some marginal seas near normal, such as the Sea of Okhotsk for example, while the Bering Sea was 70-80% lower than normal. Read more.
Highlights
- The Arctic sea ice cover continues the declining trends in the summer minimum and winter maximum extents. In 2019, the end of summer extent was tied with 2007 and 2016 as the 2nd lowest and the end of winter extent was the 7th lowest in the satellite record (1979-2019).
- As in the previous year (2017/18), the Bering Sea had little ice during most of the 2018/19 winter and 2019 spring seasons.
- The Chukchi Sea experienced very early melt onset and rapid ice loss in spring 2019, and by the end of summer 2019 reached one of the lowest ice extents in the satellite record for the region.
- Despite low extents, sea ice volume was higher over much of the central Arctic compared to the average since Cryosat-2 measurements began in 2011.

NASA image by Norman Kuring/NASA's Ocean Color Web, using Landsat data from the U.S. Geological Survey.
Primary Productivity
Autotrophic single-celled algae living in sea ice (ice algae) and water column (phytoplankton) are the main primary producers in the Arctic Ocean. Through photosynthesis, they transform dissolved inorganic carbon into organic material. Consequently, primary production provides a key ecosystem service by providing energy to the entire food web in the oceans. Primary productivity is strongly dependent upon light availability and the presence of nutrients, and thus is highly seasonal in the Arctic. In particular, the melting and retreat of sea ice during spring are strong drivers of primary production in the Arctic Ocean and its adjacent shelf seas, owing to enhanced light availability and stratification (Barber et al. 2015; Leu et al. 2015; Ardyna et al. 2017). Recent declines in Arctic sea ice extent (see essay Sea Ice) have contributed substantially to shifts in primary productivity throughout the Arctic Ocean. However, the response of primary production to sea ice loss has been both seasonally and spatially variable (e.g., Tremblay et al. 2015; Hill et al. 2018). Read more.
Highlights
- Satellite estimates of ocean primary productivity (i.e., the rate at which marine algae transform dissolved inorganic carbon into organic material) showed higher values for 2019 (relative to the 2003-18 mean) for seven of the nine investigated regions (with the Barents Sea and North Atlantic the only regions showing lower than average values).
- All regions continue to exhibit positive trends over the 2003-19 period, with the strongest trends in the Eurasian Arctic, Barents Sea, and Greenland Sea.
- During May 2019, a ~1500 km long region along the sea ice edge in the Greenland Sea showed on average ~18 times higher chlorophyll-a concentrations than the same month of the previous years (2003-18) on record.
- Unprecedented declines of sea ice in the Bering Sea in late winter 2018 and 2019 have been associated with shifts in the timing and intensity of phytoplankton blooms. Both years showed increases in chlorophyll biomass in March in the St. Lawrence Island Polynya region, associated with earlier spring break-up of sea ice. However, 2019 (unlike 2018) showed a more characteristic phytoplankton bloom in May, which may be associated with the resurgence of ice cover in April 2019.
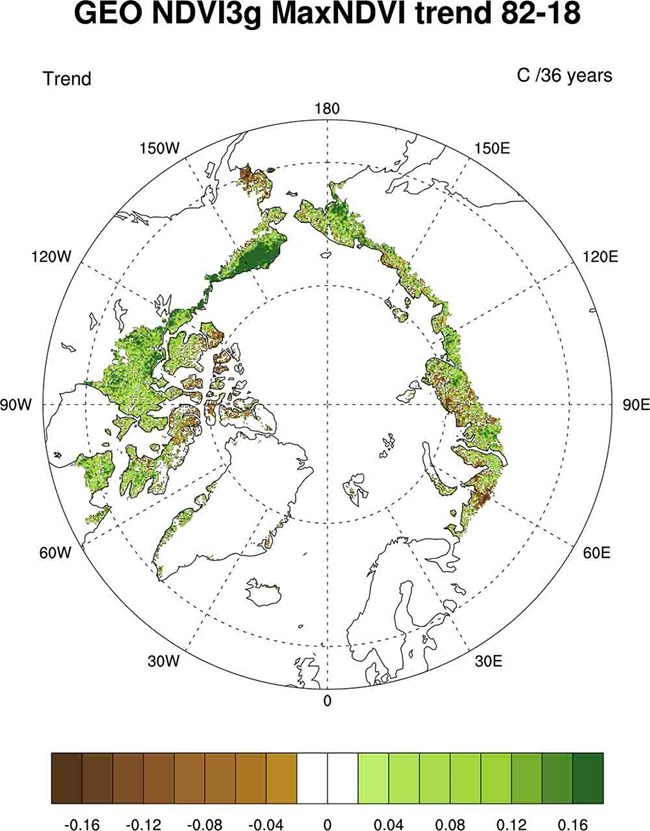
Regions with the strongest greening include the Alaska's North Slope, the Low Arctic of mainland Canada, and the Russian Far East. Tundra greenness appears to have declined, however, in western Alaska, the Canadian Archipelago, and parts of Siberia.
Tundra Greenness
Arctic lands and seas have experienced dramatic environmental and climatic changes in recent decades. These changes have been reflected in progressive increases in the aboveground quantity of live vegetation across most of the Arctic tundra biome—the treeless environment encircling most of the Arctic Ocean. This trend of increasing biomass is often referred to as "the greening of the Arctic." Trends in tundra productivity, however, have not been uniform in direction or magnitude across the circumpolar region and there has been substantial variability from year to year (Bhatt et al. 2013, 2017; Park et al. 2016; National Academies of Sciences, Engineering, and Medicine 2019). Sources of spatial and temporal variability in tundra greenness arise from complex interactions among the vegetation, atmosphere, sea-ice, seasonal snow cover, ground (soils, permafrost, and topography), disturbance processes, and herbivores of the Arctic system.
Many of the changes being observed in tundra vegetation are producing a cascade of effects on the structure and function of Arctic ecosystems. For example, changes in the height and vigor of tundra plants impact the cycling of carbon and nutrients (Blume-Werry et al. 2019; Hewitt et al. 2019; Mörsdorf et al. 2019; Salmon et al. 2019; Treharne et al. 2019), as well as the exchange of energy between the atmosphere and permafrost soils (Wilcox et al. 2019). The latter has implications for permafrost stability and surface wetness which, coupled with changes in vegetation structure, can strongly alter habitat conditions for wildlife (Cray and Pollard 2018; Tape et al. 2018; Taylor et al. 2018; Ims et al. 2019; Kolari et al. 2019). Continued monitoring of circumpolar Arctic vegetation using Earth-observing satellites and field studies improves our understanding of these complex interactions and their impacts within, and beyond the Arctic. Read more.
Highlights
- The long-term satellite record (1982-2018) indicates "greening" across most Arctic tundra regions, especially Alaska's North Slope, mainland Canada, and the Russian Far East, but trends are not homogeneous, and some regions instead exhibit no trend or "browning," such as the Canadian Archipelago, southwestern Alaska, and parts of northwestern Siberia.
- In 2018, there were stark contrasts in tundra greenness by continent, with a sharp decline in greenness in North America but a modest increase in Eurasia.
- In North America, tundra productivity for the full growing season was the second lowest on record, concurrent with relatively cool spring and summer temperatures and late snowmelt in the Canadian Archipelago and Greenland.
About the Arctic Report Card 2019
The Arctic Report Card (ARC) has been issued annually since 2006. It is a timely and peer-reviewed source for clear, reliable, and concise environmental information on the current state of different components of the Arctic environmental system relative to historical records. The ARC is intended for a wide audience, including scientists, teachers, students, decision-makers, and the general public interested in the Arctic environment and science.
The 12 essays featured in Arctic Report Card 2019 provide comprehensive summaries of key land, ice, ocean, and atmosphere observations made throughout the Arctic in the context of historical records. Taken together, the essays also serve to highlight the many strong and complex connections within the Arctic system. It is these connections that magnify the impact of the changing Arctic environment—changes that affect ecosystems and communities on a regional and global scale.
Richter-Menge, J., M. L. Druckenmiller, and M. Jeffries, Eds., 2019: Arctic Report Card 2019.
