Last updated: October 26, 2021
Article
Arctic Report Card 2018
Effects of persistent Arctic warming continue to mount
Continued warming of the Arctic atmosphere and ocean are driving broad change in the environmental system in predicted and, also, unexpected ways. New emerging threats are taking form and highlighting the level of uncertainty in the breadth of environmental change that is to come.
Following are highlights from the 2018 Arctic Report Card. View previous reports.
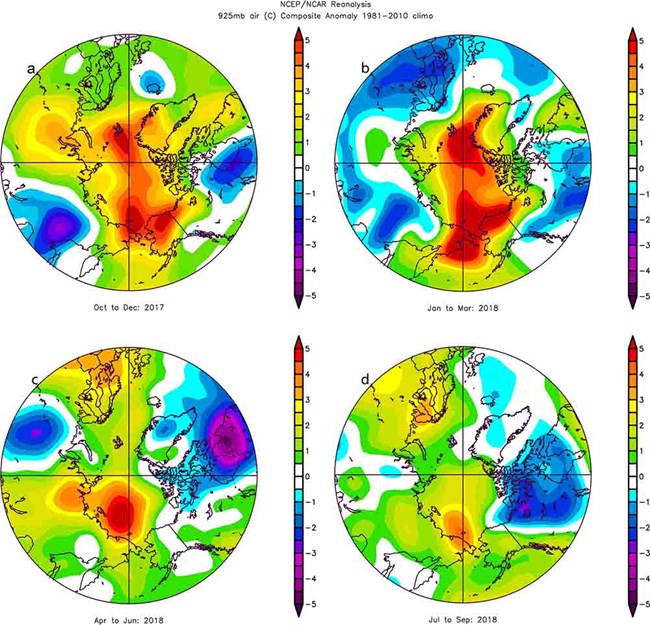
Data for this figure are available from NOAA/ESRL, Boulder, CO, at https://www.esrl.noaa.gov/psd/.
Surface Air Temperature
Arctic surface air temperature is an indicator of both regional and global climate change. Although there are year-to-year and regional differences in air temperatures driven by natural variability, the magnitude, year-to-year persistence, and Arctic-wide character of recent temperature increases is a major indicator of global climate change and the concentration of atmospheric greenhouse gases (Overland, 2009; Notz and Stroeve, 2016). Warming atmospheric temperatures also act as the driver of broader Arctic change in the terrestrial and ocean spheres. A linear relationship between global temperature change and Arctic sea ice area decline and suggest direct forcing (Mahlstein and Knutti, 2012). Tundra and glacier responses also appear as forced changes from temperature increases. We report on the spatial and temporal variability of Arctic air temperatures during the period October 2017 through September 2018, the 12-month period since the end of the previous reporting period in Arctic Report Card 2017. Read more.
Highlights
- The average annual surface air temperature over land north of 60° N for October 2017-September 2018 was the second warmest (after 2015-16) in the observational record beginning in 1900. Arctic temperatures for the past five years (2014-18) all exceed previous records.
- Arctic air temperature continues to increase at double the rate of the global mean air temperature increase.
- Relatively warm autumn, winter and spring months were related to an influx of heat and moisture from the subarctic, facilitated by north-south wavy jet stream patterns.
- During summer, neutral temperature anomalies occurred across the central Arctic Ocean and, like summer 2016 and 2017, did not support rapid summer sea ice and ice sheet loss.
Terrestrial Snow Cover
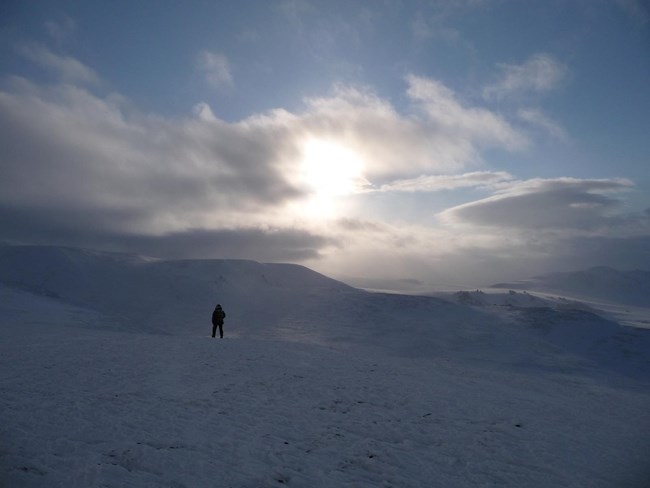
Snow covers the Arctic land surface (land areas north of 60° N) for up to 9 months each year and influences the surface energy budget, ground thermal regime, and freshwater budget of the Arctic. Snow also interacts with vegetation, affects biogeochemical activity, and influences migration and access to forage for wildlife, with consequences for ecosystems. Previous assessments in the Arctic Report Card using a combination of data from satellites and snow models show that over the past 15 years snow has melted from the land surface earlier in the spring (April, May, June) with a shallower snowpack compared to past decades. Inter-annual variability within these trends is high due to competing influences of temperature and precipitation. Read more.
Highlights
- Snow accumulation during the 2017/18 winter was well above average across the Eurasian Arctic, consistent with an early start to the snow season . North American Arctic snow accumulation was near normal until May and June when what snow remained was generally deeper than usual for the time of year.
- Snow cover extent for Eurasia was above average during April, slightly above average for May, and below average by June (relative to the 1981-2010 average). This month-to-month change is consistent with unusually high early spring accumulation combined with rapid late spring snow loss.
- Despite relatively high spring snow accumulation and snow cover extent over the Arctic during the previous two spring seasons, long-term trends remain negative.
Crew and Officers of NOAA Ship FAIRWEATHER
Sea Ice
Arctic sea ice cover varies substantially over the year, with end-of-winter ice cover generally being two to three times as large as at the end of summer. Sea ice is an important element of the Arctic system: (1) acting as a barrier between the underlying ocean and the atmosphere, (2) limiting the amount of absorbed solar energy during the summer due to its high albedo, (3) providing a habitat for biological activity, and (4) limiting human access to the Arctic Ocean. Sea ice extent has been monitored by passive microwave instruments on satellite platforms since 1979, providing a 39-year long perspective on changing coverage over the last several decades. The months of March and September are of particular interest in sea ice time-series because they represent typical Arctic sea ice maximum and minimum extents, respectively. Read more.
Highlights
- The Arctic sea ice cover continues the declining trends in the summer maximum and winter minimum extents. In 2018, the summer extent was the sixth lowest and the winter extent was the second lowest in the satellite record (1979-2018).
- There was the dearth of ice in the Bering Sea through the 2017/18 ice growth season.
Winter Bering Sea
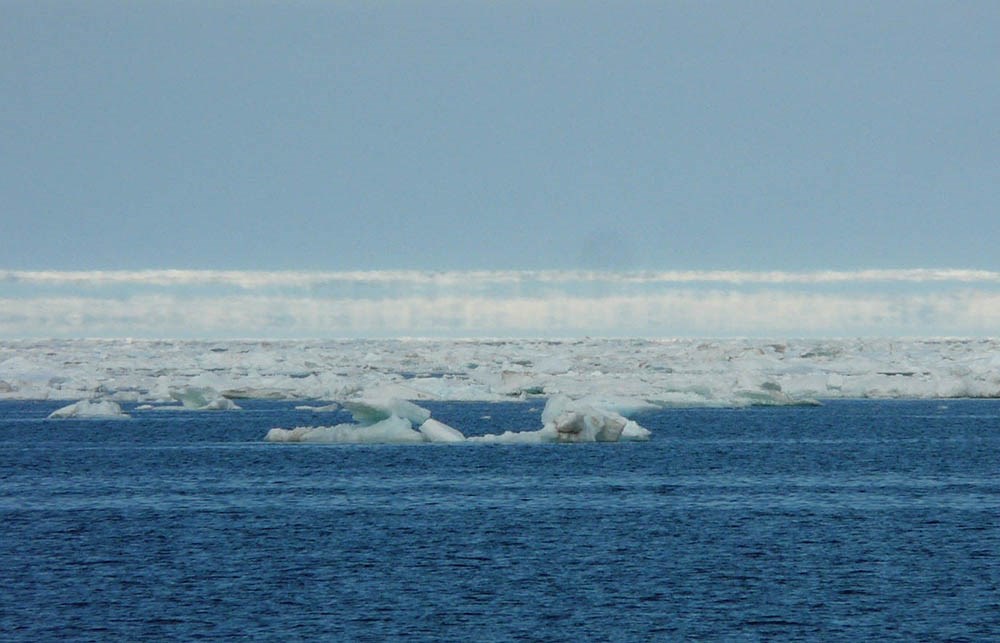
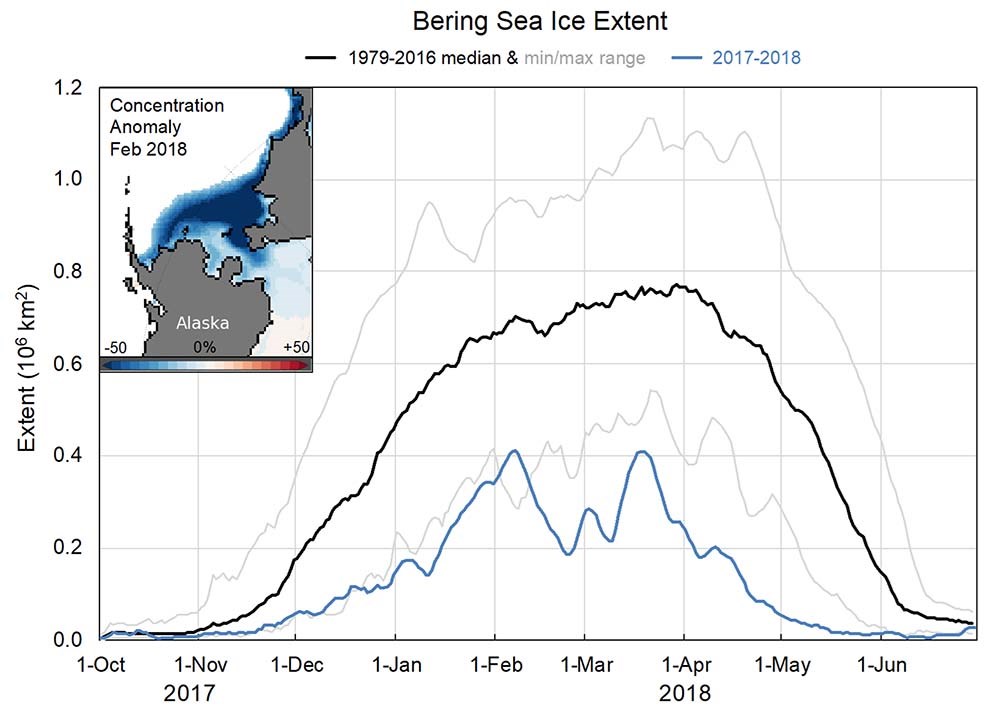
One of the more remarkable features of Arctic sea ice over the past year was the dearth of ice in the Bering Sea through the 2017-18 ice growth season. The Bering Sea supports a vibrant sea ice-ecosystem with abundant seals, birds, and other pelagic species that critically depend on the timing of sea ice formation and retreat. It is also an important commercial fishing region. Ice typically begins to form in the Bering around the beginning of October, expands through the winter and then melts away through the spring. By the end of June most or all of the Bering ice has typically melted out.
For virtually the entire 2017-2018 Bering Sea ice season, the extent was at a record low. During February, typically the height of the winter season, the Bering Sea actually lost significant ice cover. From 7 February to 23 February 2018, ice extent decreased by ~215,000 km2, dropping from ~59% to only ~26% of normal (relative to the 1979-2016 median). The Bering Sea ice cover remained extremely low until mid-March, when extent increased over a couple of weeks, though it still remained at record low levels until the season spring decline began.
Anomalously warm sea surface temperatures (SSTs) persisted in the Bering Sea from September 2017 through 2018 (NOAA's Optimum Interpolation Version 2 SST: https://www.esrl.noaa.gov/psd/map/clim/sst.shtml) and air temperatures were also well above average (NCEP/NCAR Reanalysis: https://www.esrl.noaa.gov/psd/cgi-bin/data/composites/printpage.pl). A key factor in the low Bering Sea ice was persistent southerly circulation that brought warm air and surface waters from the south and pushed sea ice that formed northward (see essay on Surface Air Temperature). Moorings measuring ocean currents and heat fluxes detected very warm water in the region in summer 2017, which likely pre-conditioned the waters for a late start to the freeze-up season (see essay on Sea Surface Temperature). The low winter and spring ice conditions allowed for early absorption of solar insolation by the ocean and warming of the surface waters. These warm ocean waters may have contributed to early summer ice loss in 2018 in the Chukchi and Beaufort seas, as the ocean heat melted ice. However, the ice loss in Chukchi slowed during July during a period of cool air temperatures in the region.
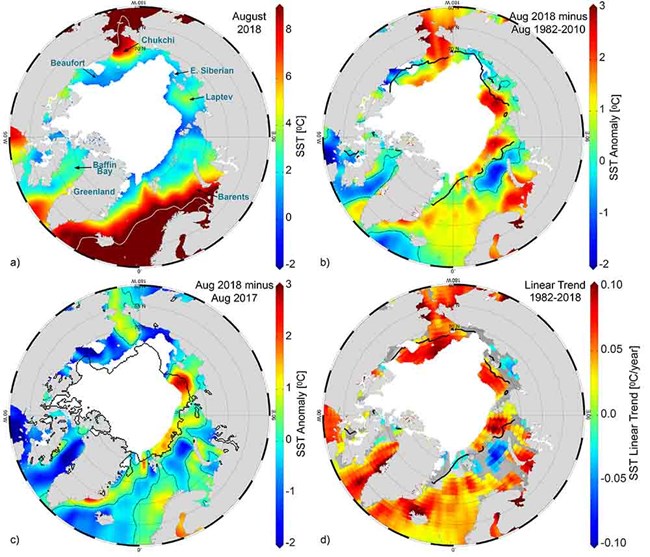
The trend is only shown for values that are significant at the 95% confidence interval; the region is gray otherwise. The black line indicates the median ice edge for Aug 1982-2010. (Sources: SST data are from the NOAA OISSTv2)
Sea Surface Temperatures
Summer sea surface temperatures (SST) in the Arctic Ocean are driven mainly by the amount of incoming solar radiation absorbed by the sea surface. Solar warming of the Arctic surface ocean is influenced by the distribution of sea ice (with greater warming occurring in ice-free regions), cloud cover, water color, and upper-ocean stratification. In the Barents and Chukchi seas, there is an additional source of ocean heat contributed by the advection of warm water from the North Atlantic and North Pacific oceans, respectively. Arctic SSTs are an essential indicator of the role of the ice-albedo feedback mechanism in any given melt season. As the area of sea ice cover decreases, more incoming solar radiation is absorbed by the ocean and the warmer ocean, in turn, melts more sea ice. In addition, marine ecosystems are influenced by SST, which affects timing and developmental cycles of primary and secondary production as well as available habitat for individual species. Read more.
Highlights
- August mean sea surface temperatures (SSTs) show statistically significant warming trends for 1982-2018 in most regions of the Arctic Ocean that are ice-free in August.
- Spatial patterns of August 2018 SST anomalies relative to the 1982-2010 August mean are linked to regional variability in sea-ice retreat, regional air temperature, and advection of waters from the Pacific and Atlantic oceans.
- Northern Barents Sea August mean SSTs show statistically significant cooling trends for 1982-2018, a result of sea ice conditions and ocean heat transport unique to this region.

Credit: Hidden Ocean 2005 Expedition: NOAA Office of Ocean Exploration. Photographer: Kevin Raskoff.
Primary Productivity
Autotrophic single-celled algae living in the sea ice (ice algae) and water column (phytoplankton) are the main primary producers in the Arctic Ocean. Through photosynthesis, they transform dissolved inorganic carbon into organic material. Consequently, primary production provides a key ecosystem service by providing energy to the entire food web in the oceans. The global oceans play a significant role in global carbon budgets via photosynthesis, contributing approximately half of Earth's net annual photosynthesis with ~10-15% of this production occurring on the continental shelves alone (Müller-Karger et al., 2005). Primary productivity is strongly dependent upon light availability and the presence of nutrients, and thus is highly seasonal in the Arctic. In particular, the melting and retreat of sea ice during spring are strong drivers of primary production in the Arctic Ocean and its adjacent shelf seas owing to enhanced light availability and stratification (Barber et al., 2015; Leu et al., 2015; Ardyna et al., 2017). Recent declines in Arctic sea ice extent (see the essay on Sea Ice) have contributed substantially to shifts in primary productivity throughout the Arctic Ocean. However, the response of primary production to sea ice loss has been both seasonally and spatially variable (e.g., Tremblay et al., 2015; Hill et al., 2018). Read more.
Highlights
- Satellite estimates of ocean primary productivity (i.e., the rate at which marine algae transform dissolved inorganic carbon into organic material) were higher in 2018 (relative to the 2003-17 mean) for three of the nine investigated regions (the Eurasian Arctic, Bering Sea, and Baffin Bay).
- All regions continue to exhibit positive trends over the 2003-18 period, with the strongest trends for the Eurasian Arctic, Barents Sea, Greenland Sea, and North Atlantic.
- The regional distribution of relatively high (low) chlorophyll-a concentrations can often be associated with a relatively early (late) breakup of sea ice cover.
Arctic Report Card 2018,
Tundra Greenness
Arctic tundra vegetation has responded to dramatic environmental changes over the course of the last several decades. The overall tendency has been an increase in the above-ground quantity of live vegetation, commonly referred to as "greening." However, vegetation changes do vary spatially, in both direction and magnitude, throughout the circumpolar Arctic and are not necessarily changing in a consistent fashion over time (e.g., Bhatt et al., 2013; Reichle et al., 2018). This variability suggests that there are complex interactions among the vegetation, atmosphere, ground (soils and permafrost), and grazing animals of the Arctic system. Changes in tundra vegetation can have important effects on carbon cycling and soil-atmosphere energy exchange (e.g., Treharne et al., 2016; Frost et al., 2018, Lafleur and Humphreys, 2018). The latter has implications for active layer depth and permafrost stability, thereby impacting Arctic landscapes. Changes in tundra vegetation can also have important effects on wildlife habitats. For instance, bird and mammal species have been shown to respond favorably (e.g., greater range and larger populations) to Arctic greening, including shrub expansion (e.g., Wheeler et al., 2018). Continued evaluation of the current state and dynamics of the circumpolar Arctic vegetation improves our understanding of these complex interactions and their impacts on the Arctic system and beyond. Read more.
Highlights
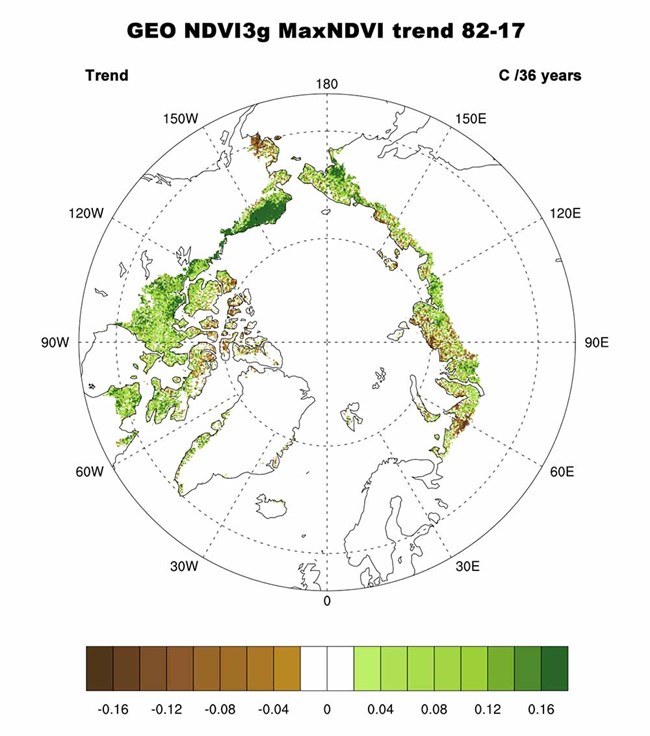
- The overall trend for the satellite record (1982-2017) is one of general greening; however, there are certain regions that exhibit browning, such as the Yukon-Kuskokwim Delta of western Alaska, the High Arctic of the Canadian Archipelago, and the northwestern and north-coastal Siberian tundra.
- Tundra greenness declined in 2017, relative to 2016, with a particularly sharp drop in the integrated growing-season value for Eurasia, which was coupled with a large decrease (24.6%) in Summer Warmth Index.
- Observations from the literature (field and other remote sensing data) across various spatial scales, from small plots to the circumpolar Arctic, continue to provide evidence for both greening and browning.
NPS?Kyle Joly
Migratory Tundra Caribou and Wild Reindeer
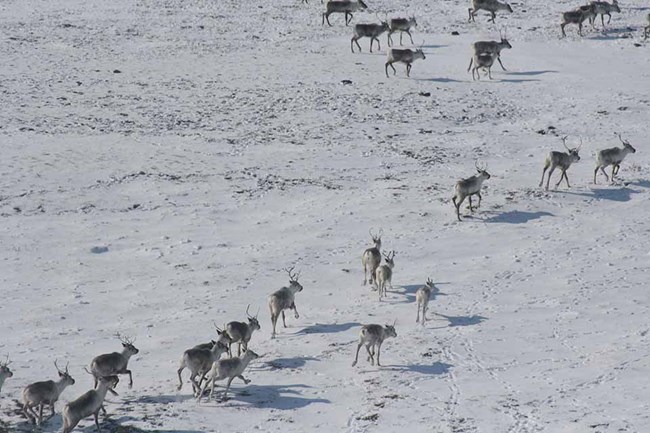
The abundance of migratory herds of caribou (North America and Greenland) and wild reindeer (Russia and Norway) in circum-arctic tundra regions has declined 56% (4.7 million to 2.1 million) over the last two decades. Five herds in particular, in the Alaska-Canada region, have declined more than 90% and show no sign of recovery. It is normal for herd numbers to vary over decades (Fauchald et al., 2017), but currently some herds have all-time record low populations since reliable record keeping began. The extent and duration of the declines are a threat to the food security and culture of indigenous people who have depended on the herds. Caribou and wild reindeer are a key species in the arctic food web contributing to nutrient cycling between terrestrial and aquatic systems and the abundance of predators and scavengers. Read more.
Highlights
- The abundance of migratory tundra caribou and wild reindeer has continued to drop since declines were detected in the mid-1990s.
- Of the 22 herds monitored, only two herds are at historic peak numbers and have not declined.
- Recent analyses link caribou productivity, particularly declining calf and adult survival, to changing climate conditions.
- Current low numbers of caribou and wild reindeer have imposed hardships for northern communities.
River Discharge
The Arctic Ocean contains only about 1% of global ocean volume but receives greater than 10% of global river discharge (Aagaard and Carmack, 1989; McClelland et al., 2012). Consequently, terrestrial influences via river inputs are much stronger in the Arctic Ocean than in other ocean basins. Rapid change in the Arctic system is altering land-ocean linkages, impacting coastal and ocean physics, chemistry, and biology. Because rivers integrate processes occurring throughout watersheds, changes in the discharge and chemistry of large rivers can also signal widespread terrestrial change (Rawlins et al., 2010; Holmes et al., 2013). Read more.
Highlights
- In 2018, the combined daily discharge of the six largest Eurasian rivers peaked on June 4, five days earlier than the average over the 1980-89 reference period. The combined daily discharge of the Yukon and Mackenzie rivers peaked on May 29, four days earlier than the average during the reference period.
- In 2018, summer/autumn discharge (July 15-September 30) for the eight largest Arctic rivers was 20% greater than the 1980-89 reference period.
- Since last covered in the Arctic Report Card in 2015, Arctic river discharge has continued to increase, providing powerful evidence for the ongoing intensification of the Arctic hydrologic cycle.
About the Arctic Report Card 2018
The Arctic Report Card (ARC) has been issued annually since 2006. It is a timely and peer-reviewed source for clear, reliable, and concise environmental information on the current state of different components of the Arctic environmental system relative to historical records. The ARC is intended for a wide audience, including scientists, teachers, students, decision-makers, and the general public interested in the Arctic environment and science.
ARC 2018 contains 14 contributions prepared by an international team of 81 researchers from 12 different countries. As in previous years, independent peer review of ARC 2018 was organized by the Arctic Monitoring and Assessment Programme (AMAP) of the Arctic Council.
Osborne, E., J. Richter-Menge, and M. Jeffries, Eds., 2018: Arctic Report Card 2018.
