Last updated: April 10, 2018
Article
The Greening of the Arctic

Trends in greenness and snow cover in Alaska’s Arctic national parks, 2000-2016
Abstract
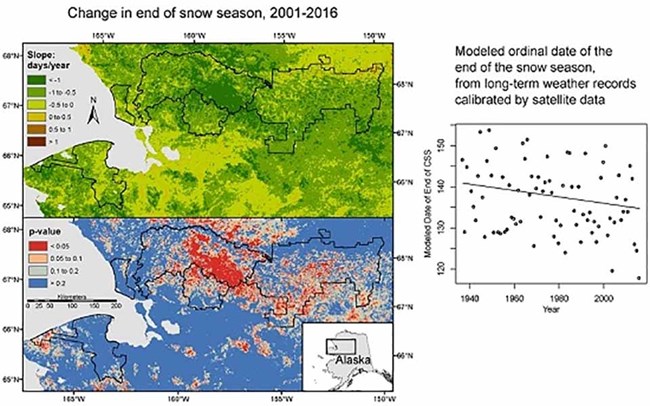
In cold-limited arctic environments, the duration and timing of the snow cover and the vegetation green season have major ecological implications. I monitored the phenology of snow cover and greenness using MODIS Terra satellite data for the years 2000 to 2016 in five national parks of northern Alaska, USA. Mann-Kendall trend tests showed that the end of the continuous snow season and midpoint of spring green-up became significantly earlier in parts of the study area over the 16-year period. Using the observed relationship between thaw degree-days at Kotzebue, Alaska and dates of snow-off and half green-up in nearby lowland tundra for the 16 years of MODIS data, I reconstructed the dates of snow-off and half green-up from long-term Kotzebue weather records back to 1937. The average snow-off and green-up dates probably became earlier by about 6 days over this 80-year time interval. Remote sensing of fall vegetation senescence and establishment of the snow cover were less reliable than the spring events due to cloudiness and low sun angles. The annual maximum normalized difference vegetation index (NDVI) generally did not increase significantly from 2001 to 2016, except in places where vegetation was recovering from forest fires.
Swanson, D. K. 2017. Trends in greenness and snow cover in Alaska’s Arctic national parks, 2000-2016. Remote Sensing 9(6):514.
