Phoebe Gilbert
Introduction
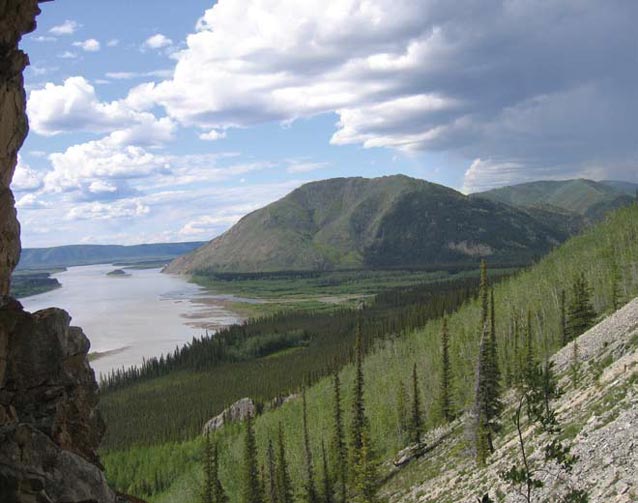
Anyone who has traveled by foot in the backcountry of Interior Alaska knows what the term ‘bushwhacking’ means. Notoriously difficult to travel in, the interior of Alaska is riddled with dense black spruce forests and wetlands. Frozen rivers make convenient travel routes in the winter, but the fast-flowing glacial rivers can be difficult and dangerous in the summers. In addition, the banks are often lined with impenetrable willow and alder thickets. This creates quite a challenge for archeologists whose job it is to search the landscape for archeological sites.
Archeological survey can be time consuming and expensive, especially in Alaska where three-quarters of the land is inaccessible via roads. Archeological reconnaissance re-quires transporting a crew into the backcountry, usually by costly means such as a helicopter or small airplane, or a time-consuming method such as boat or foot travel. To help decrease the time and expense involved in surveys, the use of computer technology is rising in popularity. Increasingly sophisticated techniques are being used to locate archeological sites. But for the most part, when planning a survey in Alaska, archeologists still look at a map, take an educated guess, and start searching. Because the areas picked for survey usually depend on access and ground visibility, we may not obtain an accurate representation of the distribution of sites across the landscape. We know that the vegetation frequently was much different several thousand years ago, and if we are only looking in places that currently have easy access and ground visibility, we may not find all the sites that actually exist. In addition, because of time and staff limitations not all ground can be surveyed, so there is always a compromise between how completely the ground is surveyed and the total area covered by the survey. Any technique that will increase the likelihood of locating sites will decrease the expense and time involved, and increase the productivity of survey.
D. Devenport
Geographic Information Systems (GIS)-based predictive modeling is a fairly young technique. Yet it has enormous potential to boost the efficacy of archeological field work and is increasingly being used to predict possible locations of archeological sites. Not every location that a computer program predicts as an archeological site will have one. By using an additional technique for this project, I am attempting to increase the productivity of the model.
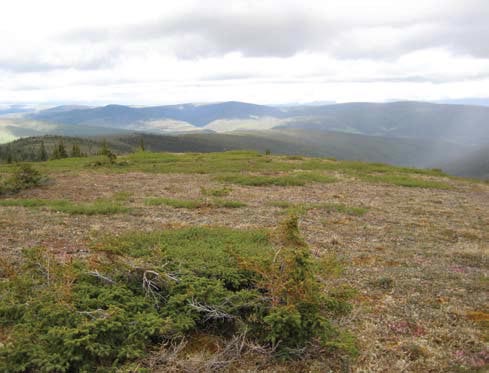
The foothills of mountain ranges, esker ridges and other elevated features are often composed of a firmer substrate, are better drained and have less vegetation than the lowlands. They provide faster, more efficient travel routes with fewer obstructions and ancient people may have used them for traveling between sites (Figure 2). These are areas that have received little archeological attention. The purpose of this project is to determine where travel and trade routes of prehistoric people existed on these elevated features in order to predict the possible locations of unknown sites along these routes. With the assistance of GIS technology, this model will hopefully make our archeological field expeditions more efficient and effective as far as time, money and productivity are concerned.
Phoebe Gilbert
Procedure
I am using GIS technology to predict possible locations of archeological sites in order to increase the likelihood of finding new sites during archeological survey. Engineers have found that using GIS to predict the best routes for roads can provide a savings of 5-15% (Yildirim et al. 2006). Using GIS may also help archeologists be more efficient regarding time and effort when surveying for new sites. Finding more sites will also provide us with a better understanding of past human use of the landscape.
This project was broken into four main parts. The first part consisted of using a control group to determine what influences peoples’ decision making process when they are choosing how to travel across a landscape. The second part was using that information to figure out possible routes that prehistoric people were using to travel between sites in the Yukon-Charley Rivers National Preserve. The third step was to look for the possible locations of unknown sites along those routes. Looking in the locations suggested by the GIS program as possible site locations will be the fourth step.
Step 1: Control Group
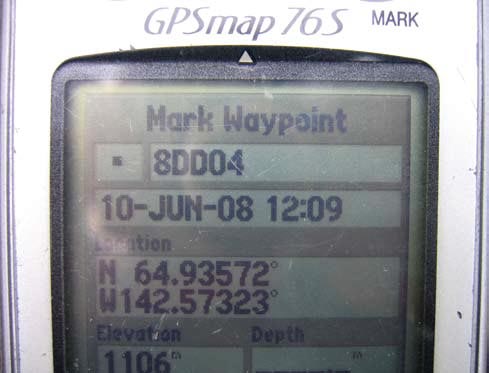
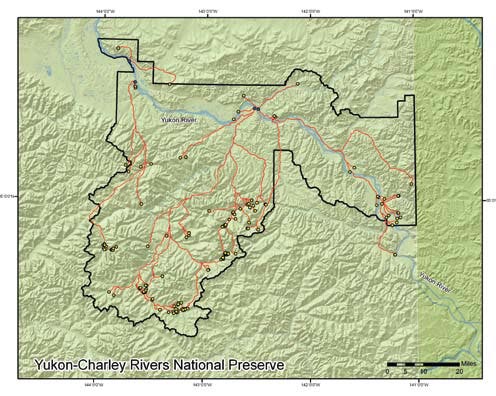
Before the potential pathways between prehistoric sites could be modeled, a control group was needed to determine the factors influencing pathway decisions. The control group was our archeological field crew, whose travel routes while surveying were tracked with Garmin Map 76 GPS units (Figure 3).
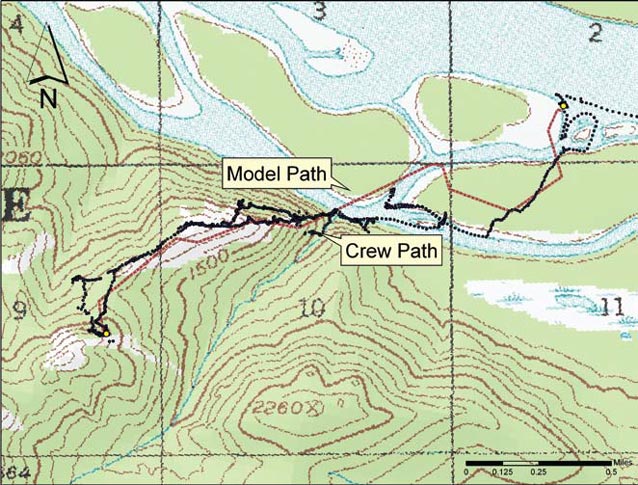
I loaded the track logs from the field crew into the ArcMap program and ran numerous tests to determine which factors carried the most weight in pathway decision making: vegetation carries more weight than slope, with a 60% to 40% ratio (Figure 4). In other words, a person traveling in the backcountry would be more willing to climb a steep slope than scramble through an alder thicket on flat ground.
Step 2: Least-Cost Pathway Analysis
A least-cost pathway analysis is based on the idea that ancient people would want to conserve energy and would pick the easiest route to travel, avoiding steep terrain and thick vegetation. So I programmed the computer to look for the easiest routes between sites that were occupied during the same time period. The analysis took into consideration not only minimum distance, but also the ease of movement across the landscape. Therefore, prohibitive vegetation and slope were considered.
Imagine that a net is put over the ground and in each cell of the net, a number is assigned to the type of terrain: if it is flat, it gets a low number; if it is steep, it gets a high number. The same technique is used for other information such as vegetation. A lower number would be given to vegetation that is easy to walk through, such as grass, and a higher number to vegetation that is hard to walk through, such as an alder thicket. Then, the grids, or nets, can be placed on top of each other and the numbers added together to identify where there is flat ground with vegetation that is easy to walk through. To determine the potential pathways, I used the weighted vegetation and slope grids from the previous step. Starting at a known site, I had the computer look for the cell next to the site with the lowest number, then the cell next to that cell with the lowest number and so on until reaching my destination, another site (Figure 5).
The sites chosen as destinations are late-prehistoric age villages that represent substantial, long term settlements. Villages are assumed to be more permanent and have higher populations than hunting camps. Village sites usually have fixed features such as house pits and are usually located at lower elevations. A village is more likely to be repeatedly occupied than a transient hunting camp and more likely to be a destination for travelers. The sites chosen as sources were stone tool scatters that are assumed to be representative of more transient, briefly occupied sites such as hunting camps. Hunting camps are often found at higher elevations with no fixed features.
Step 3: Predicting Possible Site Locations
Looking for the possible locations of unknown sites along the pathways determined in Step 2 is the third part of the project. This is done with the creation of a predictive model using the GIS program. First, we look at the characteristics of known sites. We know that sites are usually located on flat ground, close to water, with a southern exposure in a well-drained area. Knowing that sites share certain similarities, we can look for other locations that share the same characteristics along the pathways. When the computer program finds areas that share those attributes, we can survey to see if there is a site.
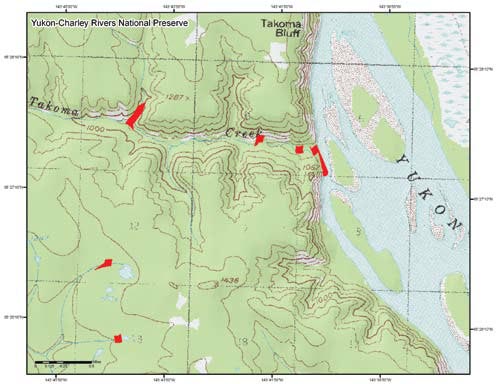
To illustrate this idea, in order to find areas of level ground close to water, I took the slope grid used in the previous steps and looked for cells with low values. Then I drew a buffer around the cell. The buffer is a specified distance away from the cell. For example, supposing people would not want to carry water more than 1,000 feet (300 m) to their campsite, I can create buffers of 1,000 feet (300 m) around the areas with level ground. Then I can do the same thing for water sources and the previously calculated pathways. Where buffers around a water source, level ground, and the pathway overlap would be good places to look for new sites since people would not want to travel too far off the path to get to a site or to get water (Figure 6).
Step 4: Testing/Validation
The next step will be to validate the model. There are two ways to validate this model. The first way is to test the model without spending large amounts of time and money. This can be done by excluding a number of known sites from the model construction, and after the model is completed, running the model to see if it predicts the location of the excluded known sites. If not, the model will need to be adjusted until it accurately predicts known sites.
The second way to validate the model is by finding new sites in the areas predicted through the GIS modeling. This will be done during the next field season by our archeological field crew surveying a random sample of the high probability areas indicated by the model.
Conclusions
Once this technique is perfected, it can be used in other areas and by other parks to focus archeological surveys. This predictive model has the potential to be valuable for archeologists, historians and land managers not only by predicting possible site locations, but by also providing new insight into prehistoric populations’ movements throughout Interior Alaska. This becomes important when analyzing subsistence resource use, communication networks, disease pathways and trade routes. In addition, this model can be beneficial to other professionals since similar techniques can be used by them to predict things such as invasive plant pathways and animal migration routes.
Acknowledgements
I would like to thank Jeff Rasic, Archaeologist, National Park Service, Greg Daniels, GIS Specialist, National Park Service, and the University of Alaska Museum of the North, Geist Fund.
References
Anderson, David G., and J.C. Gillam. 2000.
Paleoindian Colonization of the Americas: Implications from an Examination of Physiography, Demography, and Artifact Distribution. American Antiquity 65(1): 43-66.
Conolly, James, and Mark Lake. 2006.
Cambridge Manuals in Archaeology. Geographical Information Systems in Archaeology. Cambridge University Press. Cambridge, UK.
Kohler, T.A., and Sandra C. Parker. 1986.
Predictive Models for Archaeological Resource Location. Advances in Archaeological Method and Theory 9: 397-443.
Mehrer, Mark W., and Konnie L. Wescott (eds.). 2006.
GIS and Archaeological Site Location Modeling. Taylor & Francis.
Yildirim, V., R. Nisanci, and S. Reis. 2006.
A GIS Based Route Determination. Linear Engineering Structures Information Management (LESIM) Shaping the Change, XXIII FIG Congress, Munich, Germany, October 8-13, 2006.
Part of a series of articles titled Alaska Park Science: Volume 8, Issue 2: Park Science in the Arctic.
Last updated: August 10, 2016
