The Toklat Basin is a remote and intact ecosystem in northeastern Denali National Park and Preserve. Until 2003, natural and physical resource baseline data of the basin were sparse. Researchers conducted a reconnaissance survey of surficial geology, permafrost, and permafrost-related features over two field seasons and found the Toklat Basin to be a permafrost-rich environment with many geomorphic features indicative of thawing permafrost.
NPS Image
Introduction
The Toklat Basin is a remote and intact ecosystem in northeastern Denali National Park and Preserve (Denali). Until recently, natural and physical resource baseline data of the basin were sparse. We conducted a recon-naissance survey of surficial geology, per-mafrost, and permafrost-related features over two field seasons and found the Toklat Basin to be a permafrost-rich environment with many geomorphic features indicative of thawing permafrost.
The Toklat Basin is a large alluvial plain underlain by continuous and discontinuous permafrost. Permafrost is the dominant geomorphic process in the basin and is defined as soil or rock that remains at or below 32º F (0º C) for at least two consecutive years. The presence of permafrost in the Toklat Basin was known prior to this study, but information on the extent of permafrost, its sta-tus, and related features was minimal. Our reconnaissance survey was conducted over two field seasons beginning in 2003.
NPS Image
Methods
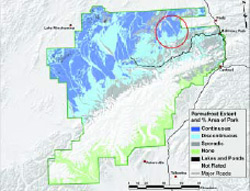
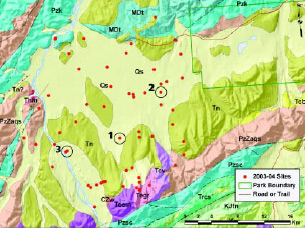
We selected field sites in the Toklat Basin based on ana-lyzing a variety of maps and remote sensing imagery. This included 1:60,000 color infrared photographs from the Alaska High Altitude Aerial Photography program, 1:6,000 low altitude aerial photographs of the Stampede Trail corridor (which bisects the basin), Landsat ETM+, SPOT, and IKONOS satellite imagery, and various U.S. Geological Survey topographic and geologic maps. We also referenced newly available soils data generated by a joint NPS - Natural Resources Conservation Service six-year soils survey of Denali (Clark and Duffy 2004). One of the many geospatial products generated from this survey was a permafrost map of the entire park (Figure 1). Once in the field, aerial reconnaissance provided for observation of previously unknown permafrost features. Field investigations at 75 sites around the Toklat Basin included soil pit analysis, geomorphology description, and depth to frozen ground measurements (Figure 2).
A depth to frozen ground (DTFG) survey helped to understand how the depth of permafrost below the ground surface varied across the Toklat Basin landscape. This helicopter-assisted systematic survey involved flying to 92 points covering about 150 square miles (388 km2). Each point was approximately 1.4 miles (2.3 km) apart along a northwest-southeast transect and 2 miles (3.2 km) apart on an east-west transect. We took three measure-ments with a metal rod at each point which were spaced 6.5 feet (2 m) apart and then averaged the results. Most measurements were taken after June 23 and before August 31 when the active layer, that seasonally freezes and thaws, has typically thawed.
NPS Photo / Chad Hults
Results
We observed that the Toklat Basin is a permafrost-rich environment with many characteristic features of pat-terned ground in arctic and subarctic areas. These include ice-wedge polygons, thermokarst depressions and ponds, solifluction lobes, beaded streams, palsas, drunken forests, nonsorted stripes and nonsorted circles.
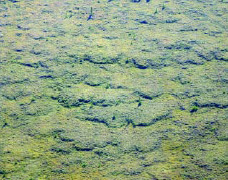
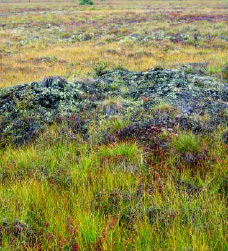
Solifluction lobes are caused by the slow downslope movement of unfrozen, saturated soil over a more stable sub-strate (such as frozen ground) and are typical of north-facing slopes in the Toklat Basin (Figure 3). Beaded streams are streams that link pools or small lakes. They are characteristic of permafrost areas that are underlain by ice wedges. The “beads” form at the junction of thawing ice-wedge polygons. Palsas are ice-cored, peat-covered mounds and are common in boggy areas of the basin (Figure 4). A drunken forest describes trees that lean at odd angles due to movement or collapse of saturated soil. Nonsorted circles (sometimes called mud or frost boils) and nonsorted stripes form due to frost sorting and frost heave. Nonsorted circles and stripes are more common in the southern part of the basin where terrain gradients are higher and rockier.
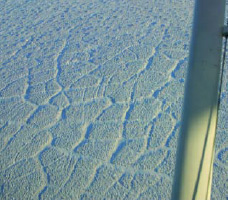
Ice-wedge polygons refer to the polygonal array of ice wedges that form as a result of repeated annual contraction of the ground in winter and subsequent freezing of water in the fissures or cracks created by contraction (Figure 5). Over time, a nascent ice-filled crack grows into an ice wedge, thicker at the top than at the bottom. Thermokarst refers to the ground subsidence and depressions that typi-cally occur when ice-wedge polygons melt and frozen ground thaws (Figure 6).
Standing water due to impenetrable, frozen ground was very common in the Toklat Basin, particularly in the northern half. This is due to the dominance of Quaternary sediments—which, in the basin, consist of fine-grained clays and silts that retain moisture and result in poorly-drained soils (Figure 2). Nenana gravel comprises much of the southern half of the basin and is better drained, due to the coarser-grained sands, pebbles, and cobbles that are characteristic of this geologic unit.
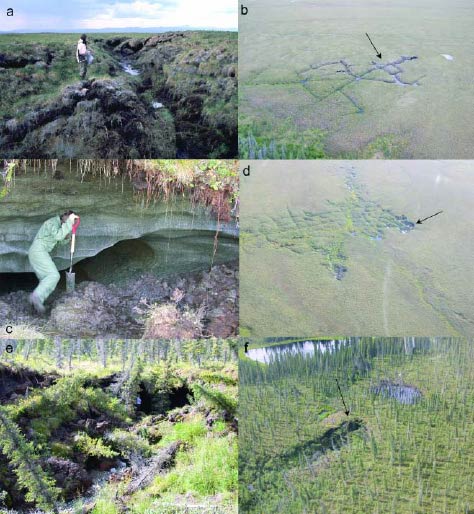
We found numerous thermokarst depressions through-out the Toklat Basin. Figures 6a and b show the “Wigand Creek” thermokarst, one of the largest thermokarsts we observed in the southern part of the Toklat Basin. The distinctive polygonal pattern of ground collapse is due to ice-wedge polygons that have melted over time. There has been significant ground collapse that has occurred at this site and curtains of tundra hang down from the normal ground surface covering exposed, intact ice wedges. Stream capture from nearby Wigand Creek could be contributing to its growth.
The “Boundary” thermokarst exhibits numerous mounds that have formed from melted ice wedges and sub-sequent ground collapse (Figure 6c-d). Exposed ice wedges are apparent at the western edge of the thermokarst, includ-ing a 25-ft wide (7.6 m) ice wedge exposure. Formerly frozen Quaternary sediments that were once above the level of the ice wedge are now thawed and have collapsed 10 feet (3 m) below normal ground surface. We observed fine-grained Quaternary sediments above and at the sides of the ice wedge, while Nenana gravel was exposed below the ice wedge. The “Wigand Creek” thermokarst exhibited the same strata.
“Hook’s Hole” consists of a cave-like space underneath the ground surface with exposed massive ice rising over 13 feet (4 m) in height (Figure 6e-f). A thaw pond, containing dead trees standing at odd angles, was present on the nor-mal ground surface about 30 feet (10 m) from the entrance to “Hook’s Hole”. A peat sample obtained from near the ice margins produced a radiocarbon age of approximately 12,000 years before present. “Hook’s Hole” was the only thermokarst we observed in a forested area in the Toklat Basin. It was also unique because it was the only large thermokarst that we found located in a previously glaciat-ed area.
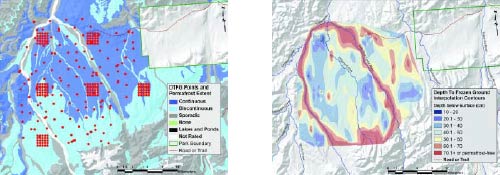
We combined all depth to frozen ground data available (75 field sites, 92 DTFG survey points, and 150 DTFG measurements from vegetation grid studies) to generate a contour map of DTFG in the Toklat Basin (Figures 7-8). We used natural neighbor interpolation (NNI) to create this preliminary map. NNI takes areas that contain data and approximates the value of nearby areas that contain no data. By using this method, we were able to approximate values of areas with no DTFG data and create a represen-tation of depth to frozen ground in the Toklat Basin. Since we needed to take into account the two major rivers that bisect the basin, DTFG data were manually generated and digitized for the Toklat and the East Fork of the Toklat Rivers. The data were assigned as areas containing no per-mafrost then added to the other 317 DTFG measurements before generating the DTFG contour map. As a result, the rivers are shown as north-south trending linear red areas (Figure 8) representing very deep permafrost or a permafrost-free zone.
NPS Photo / Larissa Yocum
Discussion and Conclusions
The Toklat Basin in Denali provides an excellent opportunity to study permafrost processes and patterned ground in subarctic Alaska. The lack of continuous forest cover in the basin allows permafrost features to be easily vis-ible and, therefore, easily monitored over time. Permafrost-dominated landscapes further west in the park are mostly forested making it much more difficult to study patterned ground from the air.
In our studies, we found permafrost to be a dominant geomorphic process in the Toklat Basin due to a variety of factors. These include fine-grained soils that are poorly drained, a predominant low-grade, north-facing aspect, a thick, insulative vegetation cover, low snow and high winds that reduce snow cover allowing cold temperatures to penetrate the ground more deeply, and a low mean annual air temperature.
NPS Photo / Chad Hults
Management Implications
Numerous thermokarsts and thawing ice-wedge polygons demonstrate that the Toklat Basin is a fragile permafrost environment, vulnerable to the warming effects of climate change and to human activities that destroy overlying ground cover. Knowledge of the role of per-mafrost in the Toklat Basin will allow for a more complete understanding of the ecosystem, and more informed, science-based management.
NPS Photos
Acknowledgements
The authors would like to thank Jon Paynter for GIS and technical support, Carl Roland and James Walton for providing Central Alaska Network vegetation grid data, and G. Matt Hook for field assistance, finding Hook’s Hole, and for flying us to every corner of the Toklat Basin.
Figure 6 Key:
(a-b) Wigand Creek Thermokarst
(c-d) Boundary Thermokarst, and
(e-f) Hook’s Hole (Labeled 1, 2, and 3, respectively, in Figure 2.)
Arrows in aerial photographs point to locations of ground photographs.
NPS Images
Figures 7 & 8:
Fig 7 (left): All physical science survey and vegetation grid points in the Toklat Basin that contain DTFG data.
Fig 8 (right) All DTFG data were combined to generate a preliminary DTFG contour map of the Toklat Basin.
References
Clark, M.H., and M. S. Duffy. 2004.
Soil Survey of Denali National Park Area, Alaska. USDA–Natural Resources Conservation Service.
Wilson, F.H., J.H. Dover, D.C. Bradley, F.R. Weber, T.K. Bundtzen, and P.J. Haeussler. 1998.
Geologic Map of Central (Interior) Alaska. U.S. Geological Survey Open-File Report 98-133.
Part of a series of articles titled Alaska Park Science - Volume 6 Issue 2: Crossing Boundaries in a Changing Environment.
Last updated: December 31, 2014
