In a 14 year mark-recapture study, scientists tracked the dynamics of small mammal populations in a watershed at the east end of Denali National Park and Preserve. Along the way, they built predictive models attempting to predict density of Clethrionomys using meteorological variables collected by NPS personnel at park headquarters, less than 3 miles (5km) from the study site. The predictive model was able to explain ~80% of the variation in annual estimates of Clethrionomys density.
Our sampling protocol and density estimation methods provide a sound method for producing measures of status and trend for small mammals. This allows park staff to be informed about the current state of small mammal populations. Rexstad & Debevec

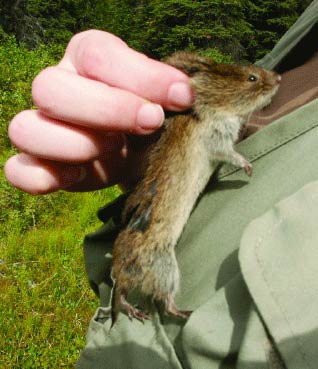
NPS Photo
Introduction
Small mammals are found near the base of the food chain in boreal forest ecosystems. They are called primary (or first order) consumers as they convert plant biomass into animal biomass. In turn, they are preyed upon by a host of carnivores higher up the food chain (Boonstra et al. 2001). Consequently changes in the abundance or density of small mammals will subsequently be experienced by the species that prey upon them. At the same time, population dynamics of this group of species can readily be estimated by fairly small field crews using fairly basic equipment, traveling largely on foot (Rexstad 1996). Life history characteristics of small mammals (short life spans, high reproductive rates, and movements restricted to less than 2 miles (4km)) cause population numbers to be reflective of local conditions. The combination of these circumstances makes small mammal populations excellent candidates for detecting change in boreal ecosystems.
Our project focused on producing annual estimates of population size of the most commonly encountered small mammal species: northern red-backed vole (Clethrionomys rutilus), tundra vole (Microtus oeconomus), and singing vole (Microtus miurus). In addition to documenting the patterns of change in these species, we attempted to model the dynamics of the most common species, the northern red-backed vole, using meteorological variables. The predictive model will serve two purposes: a) postulate possible changes to the small mammal community induced by future climate change, and b) identify departures from model predictions that may be caused by non-meteorological factors that could be susceptible to management action.
Methods
This study has been conducted annually in the Rock Creek watershed, north of the headquarters complex in Denali National Park and Preserve since 1992. Data collection protocols are described in Rexstad (1996) and consist of capturing animals using baited Sherman live traps; identifying their sex, species, and mass; placing a passive integrated transponder tag into them using a hypodermic needle; and releasing them at the capture location. Recapture of marked individuals during a sampling period provides information that allows estimation of capture probability and movement distance that in turn permits the estimation of animal density using the method developed by Efford (2004).
In most years of the project, data were collected throughout the snowfree period (June-early September), but in this manuscript, we report only on data collected during the final sampling period of each field season; i.e., data obtained between the last week of August and the first week of September. The data used to produce the density estimates presented herein were from a set of sentinel plots, consisting of a total of 400 Sherman traps sampled for a period of no less than four days for a total of 12 sampling occasions.
The estimates of density were produced using Efford’s (2004) techniques of inverse prediction. Along with the estimates of density, measures of precision or confidence intervals were computed. The number of animals caught was merely a fraction of the total number of animals in the population. An estimate of the probability of capture of individuals in the population enabled us to transform the number of animals caught to an estimate of number of animals in the population. Furthermore, animals caught in traps that are deployed in some geometric configuration are not necessarily animals that are resident in the area where the traps are laid. Animals may move into or through the trap deployment area, hence the area sampled by the trapping configuration must also be estimated. Both of these estimates and their associated measures of uncertainty contribute to our estimate of small mammal density, and likewise to our uncertainty in estimates of density. All estimates provided herein will also possess measures of uncertainty.
Having estimated density for each year of our study, we went on to construct predictive models for northern red-backed vole density using meteorological data collected at park headquarters. As the number of possible models that could be built from a set of meteorological factors is nearly infinite, we restrained our modeling enthusiasm by restricting possible meteorological factors to those tempered by our understanding of small mammal life history. Our guiding principles in selecting meteorological variables were:
- young northern red-backed vole born early in the summer are themselves capable of reproducing in their first summer of life,
- northern red-backed voles prefer moist conditions to move undetected through vegetation and as a positive influence on their food supply (Carrier and Krebs 2002), and
- damp and cool early summer conditions can be detrimental to survival of early litters who face thermoregulatory stress (Heikura 1977).
We derived three meteorological variables consistent with our biological premises. Spring onset index was the Julian date on which a cumulative degree-day measure was reached. A summer dryness index was the percentage of days between mid-June and the end of August when there was no precipitation. Spring dampness and coolness was inferred from the March Pacific Decadenal Oscillation index (Mantua et al. 1997). These predictors were fit to northern red-backed vole density using generalized linear modeling (McCullough and Nelder 1989, R Development core team 2006). The model employed a log link function, and assumed a gamma-distributed error structure. Model selection was performed using Akaike’s Information Criterion adjusted for small samples because sample size in this context is defined as the number of years of data; although each data point itself may have been estimated from many hundreds of northern red-backed vole captures.
| Coefficient | Estimate | SE (estimate) |
|---|---|---|
| Intercept | 86.44 | 17.866 |
| Spring Onset | -0.54 | 0.124 |
| Summer dryness | -1.51 | 0.365 |
| Spring dampness | -0.69 | 0.258 |
| Onset:dryness interaction | 0.01 | 0.003 |
Table 1. Analysis of variance table showing estimated coefficients and measures of precision for fitted generalized linear model predicting northern red-backed vole density as a function of meteorological predictors.

NPS Image
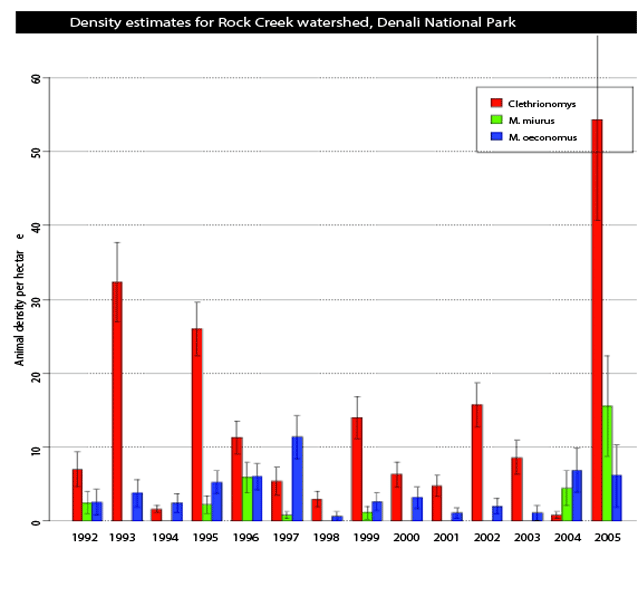
Figure 1. Density estimates (individuals.ha-1) for the three most common species encountered in the Rock Creek watershed—northern red-backed voles (red), singing voles (green), and tundra voles (blue). Confidence intervals (95%) are also depicted.
Results
Our ability to estimate density of northern red-backed vole in the Rock Creek watershed was quite good; i.e., the average coefficient of variation in our density estimates were ~14% for northern red-backed vole. In contrast, the average coefficient of variation for Microtus oeconomus was twice as large at 28%, fundamentally because many fewer Microtus oeconomus were captured. The pattern of end of field season density estimates (and confidence intervals) is show in Figure 1.
The most common species, the northern red-backed vole experienced fluctuations in density in excess of 1.5 orders of magnitude; with point estimates ranging from 0.8 individuals.ha-1 to 50 individuals.ha-1. Remarkably those extremes in estimated density occurred in consecutive years (2004 and 2005).
Our modeling work showed that all of the meteorological variables were influential in explaining variability in northern red-backed vole density. The model incorporating spring onset, summer dryness, and spring dampness as main effects (along with an interaction of spring onset and summer dryness) had the lowest AICc of the suite of 8 models fit to the data. This model explained ~80% of the variability in northern red-backed vole density. The coefficients associated with each of the predictors in the model are given in Table 1. Note that the signs of the coefficients associated with spring onset and summer dryness are both negative implying an inverse correlation between each factor and northern red-backed vole density; e.g., a late spring (large onset index) results in small predicted northern red-backed vole density. Similarly, a large summer dryness index implies a small predicted northern red-backed vole density. This also holds for the spring dampness PDO index. However the coefficient of the interaction term involving spring onset and summer dryness carries a positive sign. This term in the model attempts to ameliorate the large northern red-backed vole density that would be predicted when spring onset is early and summers are not dry.
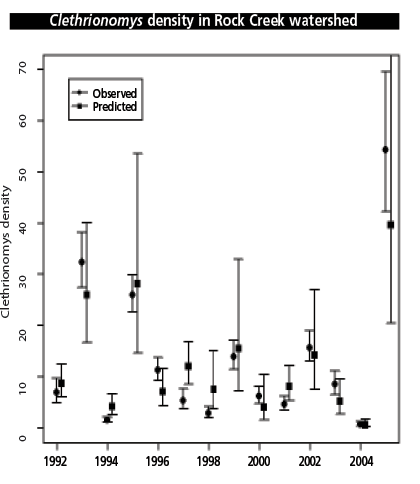
A visual assessment can be seen in Figure 2. Note the magnitude of uncertainty in the density estimates (designat-ed as observed in Figure 2) compared to the magnitude of uncertainty in our model results (predicted). It stands to reason that our predicted densities cannot be more precise than the information that was used to construct the model. Nevertheless, confidence intervals of observed (from data) and predicted (from density estimates) overlap for each year.
Discussions and Conclusions
Our sampling protocol and density estimation methods provide a sound method for producing measures of status and trend for small mammals in a watershed in Denali National Park and Preserve. This allows park staff to be informed not only about the current state of small mammal populations, but it affords a context into which to place each annual estimate. The two most extreme estimates of northern red-backed vole density occurred at the end of the time series we report here; had there not been a preceding 12 years of density estimates, it would have been very difficult to interpret the swing from 0.8 individuals.ha-1 to 50 individuals.ha-1 in a single year. We also express satisfaction at the precision with which we can estimate northern red-backed vole density. A coefficient of variation of 15%is sufficiently accurate to validly differentiate pattern from noise.
Our predictive modeling work to understand density of northern red-backed vole is gratifying, but at the same time disquieting. We conducted this modeling exercise 7 years ago, and derived a predictive model based on a different suite of meteorological variables that was equally competent in its ability to explain variation in northern red-backed vole density (Debevec and Rexstad 1999). Unfortunately the model derived in 1999, when applied to the observed densities in 2004 and 2005 failed utterly to predict those extreme events. The lesson here is that continued monitoring is the only way, short of manipulative experiments of meteorological conditions, to continue to refine our understanding of the forces that act upon these biological systems.

Figure 2. Densities of northern red-backed voles derived from mark-recapture data (circles) and predicted northern red-backed vole densities as estimated from meteorological variables shown in Table 1 (squares). Confidence intervals (95%) are also depicted.
Management Implications
It is our contention that it is fundamental to produce estimates of population attributes, such as density, along with measures of precision to provide managers with an appreciation of the biological resources they manage. The measures of precision are necessary as they permit assess-ment of whether the pattern in the time series is attributable to changes in the processes that govern the animal pop-ulation being studied, or whether the observed pattern is simply inherent stochasticity.
Beyond documenting a time series of population attributes, it is necessary to attempt to explain the patterns contained in a time series. In the case of small mammal population dynamics that we have shown are related to meteorological phenomena, resource managers will need a combination not just of the time series of population density, but also the predictive model to be able to deduce when small mammal populations are responding to phe-nomenon not contained in the model, and perhaps in the domain of the manager to influence.
Acknowledgements
Funding for this work was provided by a variety of organizations, the National Park Service, the National Biological Survey, and the USGS Biological Resources Division. Oversight for the project was provided by Dale Taylor, Pat Owen, Lyman Thorsteinsen, Joe Van Horne, Gordon Olson, Susan Boudreau, Karen Oakley, and Maggie MacCluskie. Field procedures were approved by the Institutional Animal Care and Use Committee of the University of Alaska Fairbanks. We thank the dozens of members of the 14 field crews who assisted in the col-lection of the thousands of data from which these results were derived.
References
Boonstra, R, C.J. Krebs, B.S. Gilbert, and S. Schweiger. 2001.
Herbivores: voles and mice. In Ecosystem dynamics of the boreal forest, edited by C.J. Krebs, S. Boutin, and R. Boonstra, Oxford University Press. New York. Pages 215-239
Carrier, P., and C.J. Krebs. 2002.
Trophic effects of rainfall on Clethrionomys rutilus voles: an experimental test in a xeric boreal forest in the Yukon Territory. Canadian Journal of Zoology 80:821-829.
Debevec, E.M., and E. Rexstad. 1999.
Modeling temporal patterns in microtine abundance in Denali National Park and Preserve. Poster presentation at Arctic Division AAAS annual meeting.
Efford, M. 2004.
Density estimation in live-trapping studies. Oikos 106:598-610.
Heikura, K. 1977.
Effects of climatic factors on the field vole Microtus agrestis. Oikos 29:607-615.
Mantua, N.J., S.R. Hare, Y. Zhang, J.M. Wallace, and R.C. Francis. 1997.
A Pacific interdecadal climate oscillation with impacts on salmon production. Bulletin of the American Meteorological Society 78:1069-1079.
McCullough, P., and J.A. Nelder. 1989.
Generalised linear models. Chapman & Hall. London, UK
R Development Core Team. 2006.
R: A language and environment for statistical computing. R Foundation for Statistical Computing, Vienna, Austria. http://www.R-project.org.
Rexstad, E. 1996.
Small mammal sampling protocol for long-term ecological monitoring program, Denali National Park and Preserve. Unpublished report.
Part of a series of articles titled Alaska Park Science - Volume 6 Issue 2: Crossing Boundaries in a Changing Environment.
Last updated: February 2, 2015
