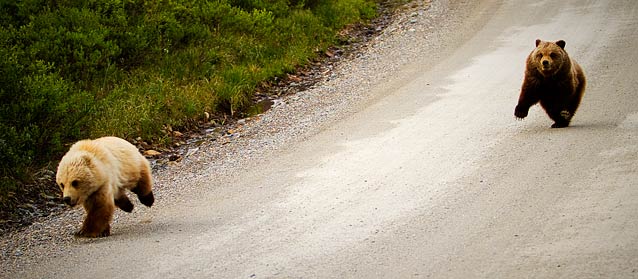
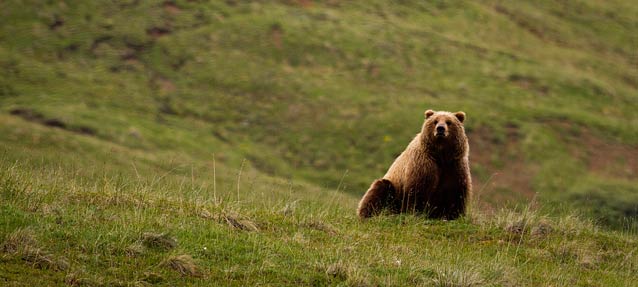
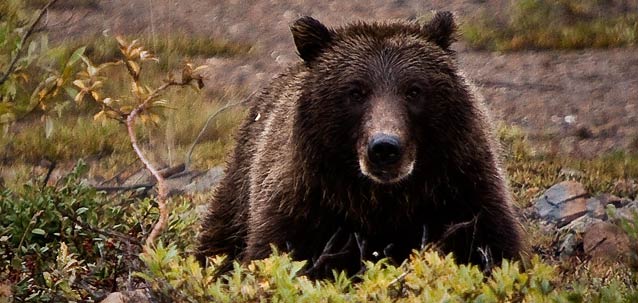
Study of a naturally regulated population of grizzly bears in Denali National Park and Preserve has been ongoing since 1988. Vital rates were calculated based on observations of adult and subadult females, yearlings and cubs. Productivity by female grizzly bears, mean litter size and adult female and cub mortality have remained relatively stable. Mortality of spring cubs is high and trends suggest an overall population that is likely decreasing slightly.

NPS Photo / Nathan Kostegian
Introduction
Grizzly bears (Ursus arctos) provide viewing opportuni-ties for visitors to Denali National Park and Preserve (Denali) both along the one road into the park and in the backcountry and provide an important resource the park is mandated to protect. Monitoring of grizzly bears is conducted by following and observing radio-instrumented individuals. Conventional radio telemetry is used to locate bears and determine number of cubs born to marked females and survival of bears in selected age classes.
Methods
Grizzly bears were captured by aerial darting from a helicopter to attach radio collars and radio tracked approx-imately twice per month from den emergence in Spring to den entrance in Fall. Visual observations from fixed-wing aircraft and from the ground were used to determine whether bears died, cast their radio collar, or exhibited collar failure. Counts of attendant young were made during two periods (pre- and post- 30 June).
Cubs and yearlings that were seen pre-30 June, but not observed during later observation attempts were considered dead (no yearling dispersal). We were unable to verify the fate of 2 and 3 year old bears that were not radio-collared. These bears could have either died or dispersed, and thus were omitted from analyses. We estimated the survival rate of four age classes of grizzly bears: adults (6+ years old), independent subadults (2-5 years old), yearlings (1 year old), and cubs of the year (<1 year old). The methods of Hovey and McLellan (1996) were used for analyses.

NPS Photo / Nathan Kostegian
Annual survival rates for radioed bears were estimated using censored telemetry data. Each radioed bear accumu-lated “radio-days.” A bear that survived an entire year achieved 365 radio-days for that year. Bears that either died or shed their collars earlier in the year tallied less days, as estimated from telemetry. The total days that each individ-ual female accumulated over the course of the study were transcribed into years of monitoring.
The reproductive rate of grizzly bears was defined as the number of female cubs born divided by the interbirth interval. Litter sizes were assumed to be 50% female. The interbirth interval was defined as the number of years that young were with their mother plus any additional years prior to the next litter. For analyses, the age of first repro-duction was set at 6 years, and the maximum age a female could attain was 35 years. Instances where the complete litter was lost were termed “whole litter losses.” Partial litter losses were those cases where some of the cubs in a litter survived the year.
Population trend (finite rate of increase, lambda) was determined by mathematically contrasting survival and reproductive rates using a derivation of the Lotka equation (Eberhardt et al. 1994, Hovey and McLellan 1996). Four parameters were used to calculated lambda: adult, subadult, yearling and cub survival, age of first reproduc-tion, litter size, and interbirth interval. A lambda value of 1.0 denotes a stable population. Values < 1.0 infer a declining population, while those above 1.0 indicate a population that is increasing. Confidence intervals for these vital rates were determined by bootstrapping procedures (Efron and Gong 1983).
| Fate of Cub Litters | Number | Percent |
|---|---|---|
| Unknown | 3 | 4% |
| Whole litter loss | 41 | 54% |
| Partial litter loss | 12 | 16% |
| No litter loss | 20 | 26% |
| Total litters | 76 | 100% |
Results
We documented the birth of 154 cubs from 76 litters born to 31 females. Mean litter size was 2.03 cubs/litter (CI =1.88 – 2.17 years). An interbirth interval could be calculated in 45 instances and averaged 2.86 years (CI =2.45-3.27). Most litters were of 2 cubs (61.0%). Three cub litters were more common (21.0%) than those with one cub (18.0%). Litter size increased as females aged, and then appeared to decline after 20 years of age.
Age of first reproduction averaged 6.7 years and varied from 5 to 9 years. The oldest bear known to have cubs was 28 years. Our estimate of female reproductive rate in Denali was 0.3477. We documented the fate of cub-of-year litters in all but 3 cases. No cub deaths were observed in 20 cases (26.0%). Conversely, in 54.0% of the cases, female grizzly bears exhibited complete loss of cub litters, which was greater than the number of partial losses. Sixty-six percent of the cub deaths occurred prior to 1 July.
We followed the fate of 39 adult female grizzly bears. Eleven of these adults died. Mean survival rate of females was estimated to be 0.9572 (mortality rate = 0.04). Relatively fewer subadult females were monitored (20 individuals for 42 radio-years), and 3 of these subadults died. Mean survival rate for subadult females was 0.9309 (mortality rate = 0.07). Yearling and cub survival rates were lower than for older bears, averaging 0.5983 and 0.3514 respectively). Ninety-nine of 148 cubs died, and 20 of 54 yearlings died. The mortality rate for yearlings averaged 0.40 while that of cubs whose fate was known, averaged 0.65. Known deaths of bears in all age classes were due to natural causes. No bears were removed by harvest or for management purposes.
Our estimate of population trend (lambda), given the vital rate estimates, was 0.9963 (CI = 0.9716 -1.0268). These data indicate, within 95% confidence intervals, that the population could be declining at an annual rate of approximately 3.8%, or growing at a maximum annual rate of 2.7%. The mean lambda indicates a population decline of 0.37% annually. Forty percent of 5000 replications of the data suggested a growing population (lambda > 1.0), while 60% of the lambda estimates suggested a stable to declining population within Denali.
| Parameter | Sample Size | Point Estimate | Lower 95% CI | Upper 95% CI | SE |
|---|---|---|---|---|---|
| Adult survival | 39 / 251 | 0.96 | 0.94 | 0.98 | 0.01 |
| Subadult survival | 20 / 42 | 0.96 | 0.82 | 1.00 | 0.04 |
| Yearling survival | 54 / 39 | 0.60 | 0.46; | 0.74 | 0.07 |
| Cub survival | 148 | 0.35 | 0.28 | 0.43 | 0.04 |
| Age first parturition | fixed | 6.0 | |||
| Litter sex ratio | fixed | 50:50 | |||
| Reproductive age | 0.35 | 0.29 | 0.43 | 0.04 | |
| Maximum age | fixed | 35 | |||
| Lambda | 0.9963 | 0.9617 | 1.0268 | 0.0166 |
Discussions and Conclusions
We obtained essentially the same survival rate for cubs as did an earlier work in Denali by Keay (2001). This is not unexpected since we used the same radioed sample of bears with an additional 6 years of data. Cub survival in Denali (35%) was similar to other non-hunted populations in North America such as Katmai (34%) (Miller et al. 2003) and Yellowstone National Park (49%) (Schwartz et al. 2006). For comparison, cub survival in the Susitna area of Alaska, where hunting for grizzly bears is allowed, was 67%(Miller et al. 2003). Cub survival within the recovery zone of the Greater Yellowstone Ecosystem, but outside of Yellowstone Park itself was 83%. In western Montana, Mace and Waller (1996) estimated cub survival to be 79%. Low cub survival in non-hunted areas, such as national parks and wildlife preserves, where populations are at near capacity, is believed indicative of density-dependence population regulation. Although not confirmed, high cub and yearling mortality in Denali is believed to be a result of either starvation or predation as was the case for Yellowstone National Park (Schwartz et al. 2006). No cubs were known to have been removed from the system by man during the study. Although density-dependent regulation is suspected, the fact is that the causes of most cub and yearling deaths remain unresolved. Miller (1990) cautions that density regulated deaths should not be assumed unless specific cause of death can be determined. Unfortunately, due to logistics, determining the cause of such deaths in the field remains elusive. Our estimate of adult female survival (96%) was close to Keay’s (2001) earlier work of 97%. Annual survival rates for adults that are ≥ 95% are indicative of lightly hunted or non-hunted populations. Our results deviate from Keay’s (2001) previous work for yearling and subadult survival. These differences may be due to our larger sample sizes for these classes, longer duration, different methods, and larger sample size. Our estimate of population trend in Denali, suggests a generally stable population with a mean estimate of lambda = 0.9963. However, within the bounds of probability, there is a greater likelihood that the population is decreasing at a maximum rate of approximately 3.8% annually, than that the bear population is growing. A stable to decreasing population is likely given the low survival of cubs and yearlings. The mean estimated birth rate in Denali of 0.6954 (reproductive rate of .3477 x 2), was similar to the observed annual mortality rate for cubs (0.6486). These metrics suggest that birth and death rates were nearly equal.

NPS Photo / Nathan Kostegian
Management Implications
This is one of the longest running studies of a naturally regulated population of grizzly bears. Vital rates calculated indicate regulation of the grizzly bear population in Denali National Park and Preserve is likely density dependent. Given that the population trend appears to be decreasing, long term monitoring of this system should continue. Effort should be made to determine the cause of high mortality in cubs and yearlings to verify density dependent regulation.
Acknowledgements
Many pilots deserve our appreciation for safe flights over the years. We also thank the many observers who assisted in data collection.
References
Eberhardt, L., B. M. Blanchard, and R. R. Knight. 1994.
Population trend of the Yellowstone grizzly bear as estimated from reproductive and survival rates. Canadian Journal of Zoology 72:360-363. Efron, B., and G. Gong. 1983.
A Leisurely Look at the Bootstrap, the Jackknife, and Cross-Validation The American Statistician, Vol. 37(1):36-48
Hovey, F.W. and B. N. McLellan. 1996.
Estimating population growth of grizzly bears from the Flathead River drainage using computer simulations of reproductive and survival rates. Canadian Journal of Zoology 74:1409-1416.
Keay, J. A. 2001.
Grizzly bear population ecology and monitoring: Denali National Park and Preserve, Alaska. Report of project development and findings 2001. Alaska Biological Science Center, Anchorage, AK.
Mace, R. D. and J. S. Waller. 1998.
Demography and population trend of grizzly bears in the Swan Mountains Montana. Conservation Biology 12:1005-1016.
Miller, S.D. 1990.
Population management of bears in North America. Ursus. 8:357-373.
Miller, S.D., R. A. Sellers, and J.A. Keay. 2003.
Effects of hunting on grizzly bear survival and litter sizes in Alaska. Ursus. 14:130-152
Schwartz, C. C., M.A. Haroldson, R.B. Harris, S. Cherry, K.A. Keating, D. Moody, and C. Servheen. 2006.
Temporal, spatial, and environmental influences on the demographics of grizzly bears in the greater Yellowstone Ecosystem. Wildlife Monograph 161.
Part of a series of articles titled Alaska Park Science - Volume 6 Issue 2: Crossing Boundaries in a Changing Environment.
Last updated: April 13, 2016
