Courtesy Martin Jeffries
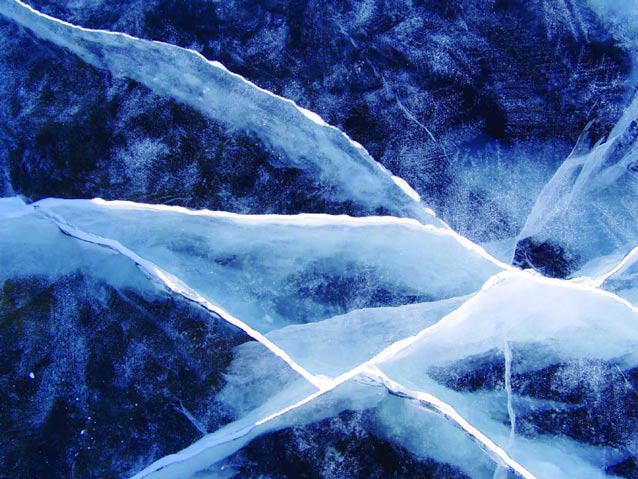
Since the Denali National Park and Preserve Visitor Center opened in summer 2005, many thousands of people have seen Heartbeats of Denali, a film that introduces visitors to the annual cycle of the park ecosystem. For a freshwater ice scientist, the segment that shows bare, heavily-cracked and wind-polished ice on the Nenana River is particularly interesting. Extending horizontally many tens of meters, the wide, snow-filled, thermal cracks give the ice cover the appearance of crazy paving.
Thermal cracking also occurs under snow cover, on both river ice and lake ice, but the absence of snow amplifies the process and its effects. Without an insulating snow layer, the top of the ice becomes very cold, almost as cold as the air above, while the bottom, resting on water, remains at 32°F (0°C). The large temperature difference causes the ice to bend upwards and crack when it can no longer withstand the curvature (Metge 1976). If this process is repeated often enough, the entire ice cover is reduced to a series of smaller, angular plates defined by a dense network of inter-secting cracks; hence the appearance of crazy paving on the frozen Nenana River.
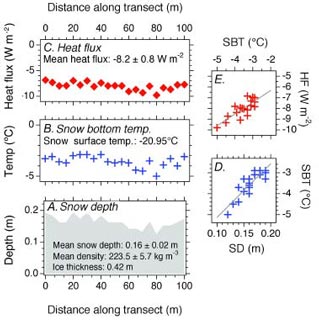
The effectiveness of snow as an insulator is illustrated in Figure 1. It shows data obtained at Horseshoe Lake, 2.2 miles (3.5 km) north of the DNPP Visitor Center. On a cold (-5.7°F, -20.95°C) day in early December 2003, when the ice was 16.5 inches (0.42 m) thick, the average depth of snow on the ice was 6.3 in (0.16 m) (Figure 1a), and the average temperature at the base of the snow was 25.5°F (-3.6°C), a 31.2°F (17.35°C) difference (Figure 1b). The insu-lating effect of the snow is further illustrated by the almost linear relationship between ice surface temperature and snow depth values (Figure 1d), i.e., the deeper the snow, the higher the temperature on the ice surface at the bottom of the snow.
The data in Figure 1 were obtained by third, fourth and fifth grade students from Tri-Valley School, Healy, about 8.1 miles (13 km) north of the lake. Since autumn 2003, a total of 60 different students have visited their frozen study site to measure ice thickness, and the depth, density and temperature of the snow on the ice. Because it is a mixed-grade class, some students have been making measurements for as many as three consecutive winters. Integrated into their science and language arts classes, the Horseshoe Lake project has taken students outdoors in winter to study their local ecosystem.
The Tri-Valley School students participated in ALISON (Alaska Lake Ice and Snow Observatory Network), an exemplary scientific research and science education partnership of K-12 educators and students, and university scientists and educators (Abbott and Swanson 2006). In winter 2005-06, Horseshoe Lake site was one of 22 ALISON sites, 19 of them run by teachers and their students, in four of Alaska’s six climate zones—Arctic, Interior, West Coast and Southcentral (Pearson and Hermans 1998).
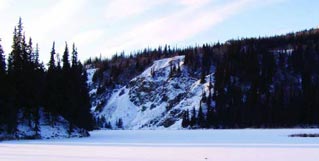
Horseshoe Lake is an oxbow lake (Figure 2) that formed when a meander in the Nenana River was cut off from the main channel. Located 1.55 miles (2.5 km) from and 200 ft (60 m) below the trailhead, the lake is a popular hiking destination in sum-mer, but sees much less traffic in winter. Always snowy, occasionally icy due to mid-winter thaws and rain, and steep in places, the winter trail did not deter the intrepid young scientists from Tri-Valley School.
The Horseshoe Lake study site, like most ALISON study sites, consisted of an ice thickness gauge and a 330 ft (100 m) long transect marked by 21 wooden stakes spaced 16.5 ft (5 m) apart. The study site was set up in early autumn once the ice is thick enough to support a party composed of Jeffries, Morris and volunteers from the National Park Service (NPS) and the Alaska Natural History Association (ANHA). After setting up the study site, we visited the school to meet the students and engaged in a wide-ranging discussion about ALISON measurements, and snow and ice science.
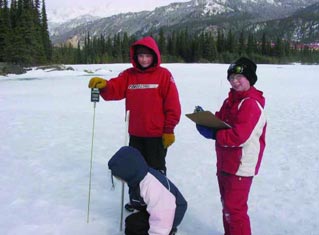
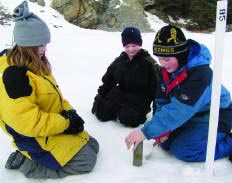
Each time the students visited the site they measure the snow depth and the tempera-ture on the ice surface at the base of the snow at each stake (Figure 3). Using the same probe, they also measure the temperature at the top of the snow at the beginning and end of the transect, and then calculate the average of those two values. Snow samples of known depth are collected with a metal cylinder (Figure 4) at three different points along the transect, placed in plastic bags and returned to school to be weighed.
Courtesy Martin Jeffries
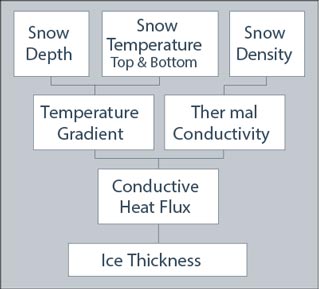
The snow depth and top/bottom temperature data were entered into a computer spreadsheet, which calculates the temperature gradient (Figure 5) at each of the 21 stakes. The temperature gradient describes the change in temperature over a change in snow depth. The spreadsheet also calculates the density (Figure 5) of the three snow samples from their depth and mass, and the cross-sectional area of the metal sampling cylinder. Finally, the spreadsheet converts the snow density to thermal conductivity (Sturm et al., 1997) and multiplies that by the temperature gradient to give the conductive heat flux (flow) (Figure 5) (Sturm et al. 1998) at each wooden stake.
Thermal conductivity is simply a measure of how well or how poorly a material conducts heat. For example, the mean density of the snow on 4 December 2003 (Figure 1), 14 lbs/ft3 (224 kg/m3), corresponds to a thermal conductivity of 0.00355 BTU/inch hour °F (0.0737 Watts per meter Kelvin). This is very low compared to the ice (2.3 W/m.K) beneath the snow on Horseshoe Lake, or familiar materials in the vicinity of the DNPP Visitor Center; for example, plywood (0.13), asphalt (0.75), glass (1.05) and steel (46.0). Snow, then, with its low thermal conductivity, is a poor conductor of heat. Or, conversely, it is a good insulator. Thus, on 4 December 2003, the snow was acting as a good insulator, protecting the ice from the cold air above; hence the higher temperatures at the bottom than at the top of the snow (Figure 1b).
The amount of heat that was being conducted through the snow cover on 4 December 2003 is shown in Figure 1c. The average conductive heat flux along the 330 ft (100 m) transect was -2.6 BTU/ft2 hour (-8.2 W/m2), but it varied almost linearly with the depth of snow, i.e., the deeper the snow, the lower the heat flow (Figure 1e). This is because the temperature gradients in the deeper snow are not as high as those in the shallower snow, and lower temperature gradient values multiplied by the thermal conductivity give lower conductive heat flow. The conductive heat flow is important because it is the main source of heat transfer through the ice and snow in the winter, and dominates the surface energy balance. Consequently, the conductive heat flow is a key determinant of the bottom freezing rate and thus the ice thickness.
The Horseshoe Lake ice does not grow thicker by bottom freezing alone. The thickness can also increase by the addition of ice at the top. This is a consequence of the following sequence of events: (1) the mass of accumulating snow pushes the ice surface below the water surface; (2) water percolating upwards to the ice surface through fractures mixes with the snow to form slush; and (3) the slush freezes to form snow ice, sometimes also known as overflow ice. During Winterfest in late February 2005, we observed snow ice layers as much as 9.1 inches (0.23 m) thick, about 41% of the total ice thickness (22 in, 0.56 m).
Courtesy Martin Jeffries
The Horseshoe Lake ice does not grow thicker by bottom freezing alone. The thickness can also increase by the addition of ice at the top. This is a consequence of the following sequence of events: (1) the mass of accumulating snow pushes the ice surface below the water surface; (2) water percolating upwards to the ice surface through fractures mixes with the snow to form slush; and (3) the slush freezes to form snow ice, sometimes also known as over-flow ice. During Winterfest in late February 2005, we observed snow ice layers as much as 9.1 inches (0.23 m) thick, about 41% of the total ice thickness (22 in, 0.56 m).
Ice thickness is measured with a heated-wire gauge. This is nothing more than a simple electrical circuit frozen into the ice. The essential part of the circuit is a resistance wire of known length with a wooden handle at the top end and a metal weight (toggle) at the bottom end in the water below the ice. When a 12-volt battery is connected to the circuit, the resistance wire heats up (an example of Joule heating and Joule’s Law in action), melts the ice around it, and the metal toggle can be raised and lowered using the wooden handle. With the toggle pulled up against the bottom of the ice, the length of resistance wire between the wooden handle and the ice surface is measured and subtracted from the total length of wire. The difference between the two lengths is the ice thickness. This ice gauge allows the ice thickness to be measured at the same location on many occasions with minimal disturbance to the ice and snow cover.
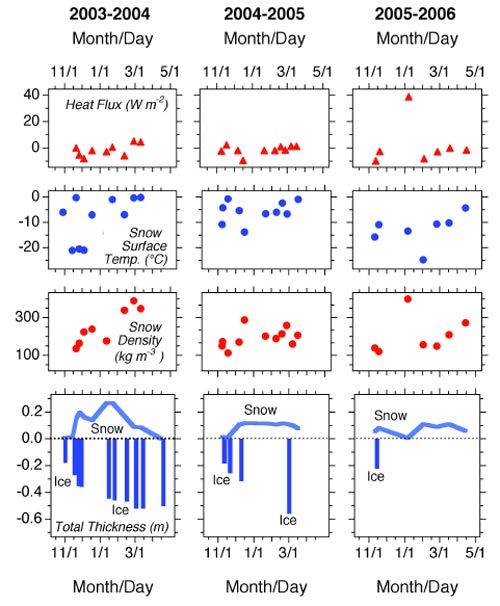
The data obtained by the Tri-Valley School students since autumn 2003 at Horseshoe Lake are illustrated in Figure 6. The students have visited their study site in a broad range of weather conditions, as illustrated by snow surface temperature values as high as 32°F (0°C) and as low as -5.8°F (-21°C). On one occasion, a student who complained about the cold was told by another student that “A true scientist never gets cold”. While no wind speed data are available for the lake, the snow depth and density data tell us that it is a windy location. For example, the fluctua-tions in snow depth in 2003-4 and 2005-6 are due to wind erosion of the snow cover followed by further precipitation and accumulation. The greatest wind erosion occurs towards the end of the sampling transect (55-100 m, Figure 1) near the cliff (Figure 2).
Snow crystals deposited, or eroded and redeposited, under windy conditions are more tightly packed together and thus more dense than those that accumulate under calm conditions. Consequently, the snow on the Horseshoe Lake ice is invariably more dense than that at the Fairbanks ALISON site, for example, and sometimes as dense as that at the windiest ALISON sites— Barrow, Nome and Wales (Jeffries and Morris 2006). Like all the ALISON sites, the conductive heat flow at Horseshoe Lake is on the same order of magnitude as that through the snow cover on sea ice in the Arctic and Antarctica ( Jeffries and Morris 2006). The data obtained at Horseshoe Lake, combined with those from all the other ALISON study sites, have revealed for the first time the magnitude of the conductive heat loss from frozen ponds and lakes, and their importance as winter heat sources.
The ice thickness data are not as complete as the other data sets because the ice thickness gauge has malfunctioned. This is unfortunate from a data collection perspective, but there is an educational silver lining: it demonstrates to the students that in science, as in life in general, things can and do go wrong. The failure of the ice gauges does not, however, reduce the value of the other data. As far as we are aware, the Tri-Valley School students are the first to make systematic snow and ice measurements at Horseshoe Lake. The students are contributing to the knowledge and understanding of the DNPP ecosystem. And the more winters that they visit the lake, the more valuable the data and the students’ contribution to Denali science.
Courtesy Martin Jeffries
But ALISON is not just about making measurements and obtaining data for scientific research purposes. The scientific research aspects of ALISON go hand in hand with science education. ALISON is a place-based, experiential learning opportunity for teachers and students, who are learning science by doing science. They are being field scientists (Abbott and Swanson 2006), engaging in a fundamental scientific activity, i.e., making measurements. According to Abbott and Swanson (2006), students participating in ALISON “… are learning the science behind the measurements through classroom and fieldwork activities.” and “… experiencing scientific inquiry at its best …”. Scientific inquiry is at the core of the National Science Education Standards (NRC 1996) and the Alaska Science Content and Performance Standards (AKDEED 2005).
ALISON measurements are simple and easy for a wide age range of students to make and understand (Abbott and Swanson 2006). They are measuring some aspects of abundant materials that are familiar to most, if not all, Alaskan students—snow and ice. Consequently, students understand the relevance of ALISON, are more likely to assume ownership of their study, and students who normally might not take much pride in their work become more involved and excited (Abbott and Swanson 2006).
The Tri-Valley School students have certainly enjoyed making lake ice and snow measurements. They have given them a reason to learn, for example, some International System units, the modern metric system of measurement, and now they know the difference between the Celsius and Fahrenheit units of temperature. By visiting Horseshoe Lake as part of the study of a local ecosystem, the students have learned to observe, reason and predict. They have addressed questions such as “why does it rain rather than snow?”, “how cold does the weather have to be for snow to fall?”, “what types of plants and animals survive beneath the snow through the winter?”, “which animals need snow for survival?”, and “does lake ice differ from river ice?”. The students have learned that science is fun and that it continues through the winter no matter what the weather.
The Tri-Valley School students are the youngest participants in ALISON. They have demonstrated that elementary school students are capable of doing good science in their own backyard that contributes, in this case, to a larger goal of increasing the knowledge and understanding of the variation of lake ice and snow characteristics and processes around the huge state that is Alaska. It is our hope that the Tri-Valley School students will be able to continue visiting Horseshoe Lake through at least spring 2009, and thus, along with ALISON students elsewhere in Alaska, be able to say that they were scientists during the International Polar Year of 2007-2009.
Acknowledgements
We thank Martha Tomeo for encouraging discussions about having an ALISON site at Horseshoe Lake, David Tomeo (Alaska Geographic), and Phil Brease, Kristen Friesen, Pam Sousanes and Larissa Yocum (all NPS) for their assistance setting up the study site in the autumn, helping with class field trips during the winter, and retrieving equipment in the spring.
ALISON has been supported by grants from the National Science Foundation (ESI0109082, OPP0326631), the International Arctic Research Center at the University of Alaska Fairbanks under the auspices of NSF Cooperative Agreement OPP0002239, and the University of Alaska Natural Resources Fund and the President’s Special Projects Fund.
References
Abbott, C., and M. Swanson. 2006.
A rewarding partnership: Critical components of a successful collaborative scientist-student partnership. The Science Teacher, April/May, 32-35.
AKDEED. 2005.
Content and Performance Standards for Alaska Students. Third Edition. Alaska Department of Education and Early Development. Juneau, AK.
Jeffries, M.O., and K. Morris. 2006.
Instantaneous daytime conductive heat flow through snow on lake ice in Alaska. Hydrological Processes 20: 803-815.
Metge, M. 1976.
Thermal cracks in lake ice. Ph.D. dissertation. Queen’s University, Kingston, Ontario, Canada.
National Research Council (NRC). 1996.
National Science Education Standards. National Research Council, National Academy Press. Washington, D.C.
Pearson, R.W., and H. Hermans. 1998.
Alaska In Maps: A Thematic Atlas. University of Alaska Fairbanks.
Sturm, M., J. Holmgren, and K. Morris. 1997.
The thermal conductivity of seasonal snow. Journal of Glaciology 43: 26–41.
Sturm M., K. Morris, and R.A. Massom. 1998.
The winter snow cover of the West Antarctic pack ice: Its spatial and temporal variability. In Antarctic Sea Ice: Physical Processes, Interactions and Variability, edited by M.O. Jeffries. Antarctic Research Series, Volume 74. AGU, Washington, D.C. Pages 1-18.
Last updated: March 18, 2015
