Last updated: August 10, 2017
Article
Space-Based Burn Severity Mapping in Alaska’s National Parks
By Brian Sorbel and Jennifer Allen
National Park Service photograph
Introduction
Wildland fire is a powerful force of change across the landscape of Alaska. During the 2004 summer, record high temperatures and low precipitation resulted in the largest fire season in the state’s recorded history, with more than six million acres burned. While the extent of the 2004 season was impressive, fires are a yearly summer occurrence. Over the past 50 years, wildland fires have burned nearly two million acres in 14 of the 16 National ParkService units in the state. In their path, fires dramatically alter the vegetation and landscape
of the parks. Fire is a natural phenomenon linked to the dynamics of many plant communities and animal populations.
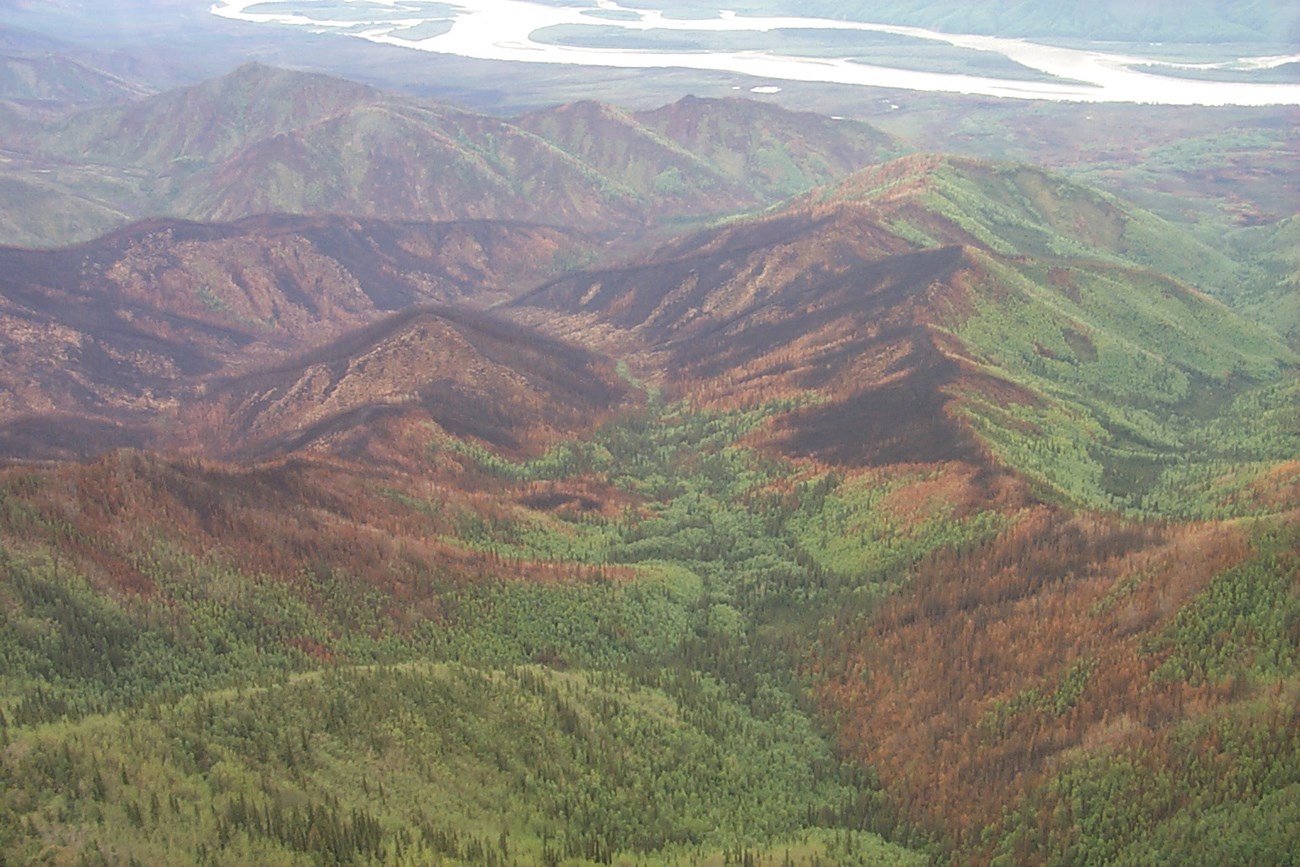
A common misconception of wildland fires is that they affect all burned areas the same. In reality, the effects of fires across the landscape are highly discontinuous and varied. As fires burn under different weather conditions, across changing topography and vegetation types, their behavior and effects also dramatically change. In any given fire, some areas of the landscape are radically changed due to intense scorching or sustained burning, while other areas are completely untouched. This varying burn severity results in a heterogeneous pattern or fire mosaic on the landscape (Figure 1).
Burn severity is a measure of the ecological impacts of the fire, in terms of plant survivorship or mortality, depth of the burn in organic layers, or amount of biomass
consumed (Figures 2-4). Information about burn severity helps fire and resource managers
understand the effects of wildland fires on the fuels, vegetation, and wildlife.
The NPS Fire Management Program, in conjunction with the U.S. Geological Survey
(USGS) EROS Data Center in Sioux Falls, South Dakota, have used remote sensing to
map burn severity for all large NPS fires in Alaska since 1999. In addition, fire management
staff have installed nearly 300 plots to assess the accuracy of these remotelysensed
maps. This paper describes the methods used to map burn severity and to assess the accuracy of the maps, and discusses the ecological effects and applications of burn severity mapping for NPS fire and resource management.
Left image
Credit: National Park Service photograph
Right image
Credit: National Park Service photograph

National Park Service photograph
Satellite Measures of Severity: Landsat Imagery and the Normalized Burn Ratio
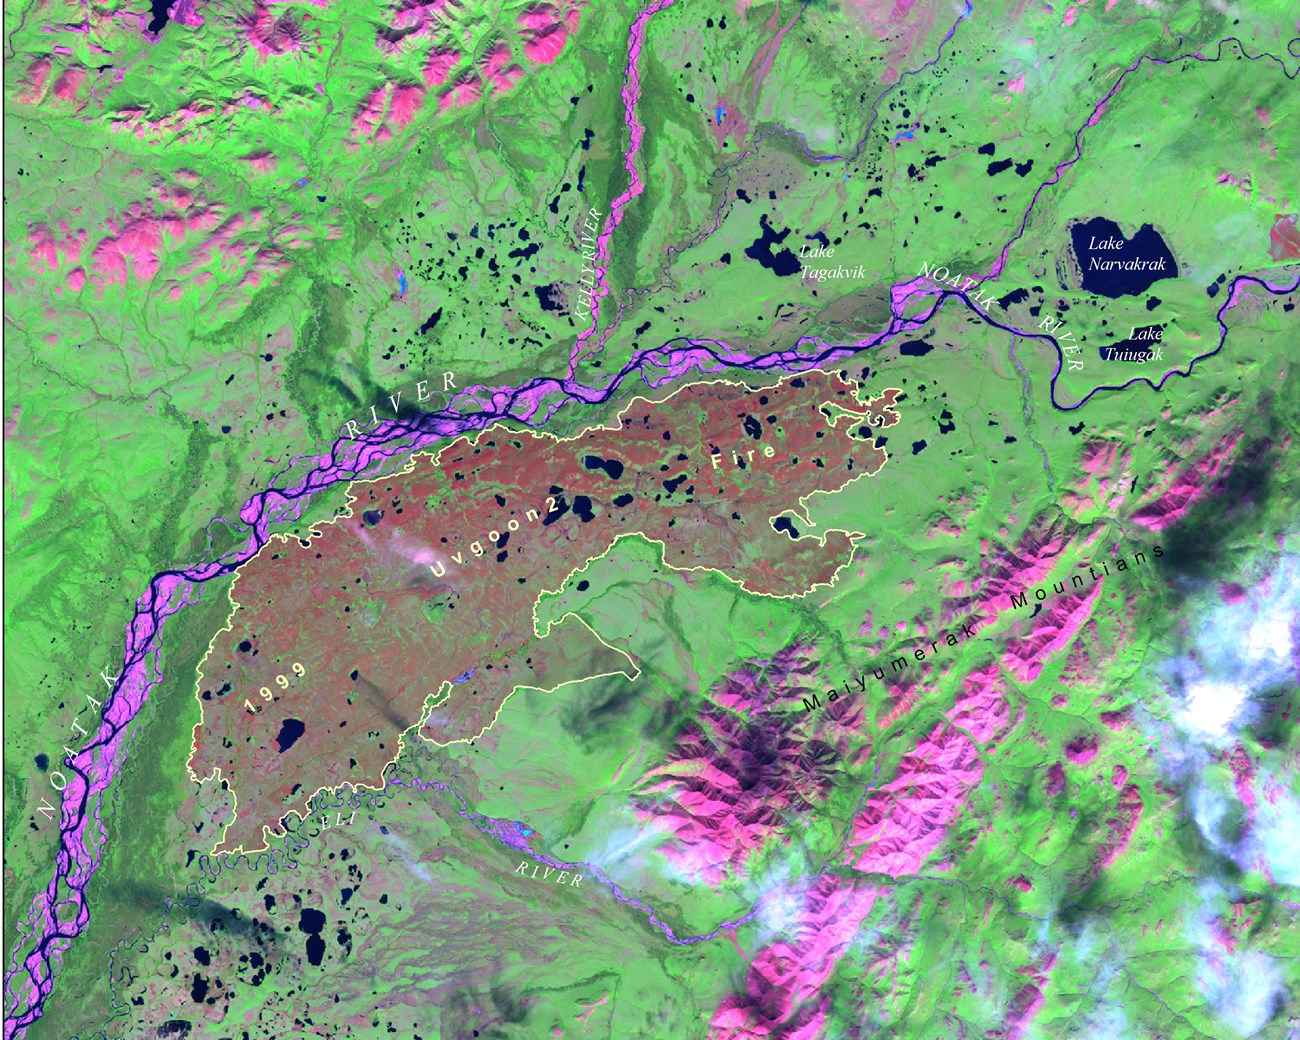
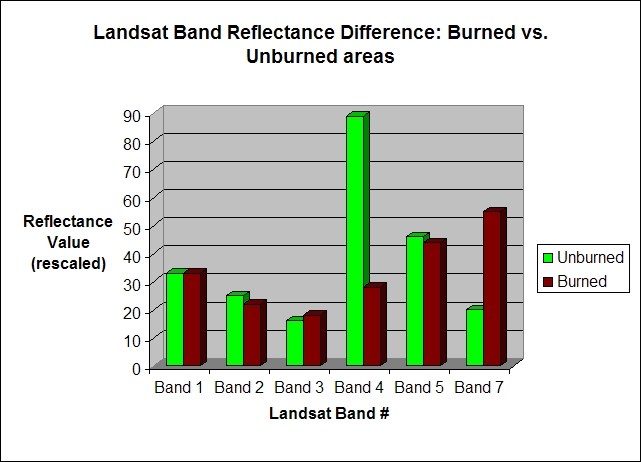
On-site mapping of burn severity in Alaska national parks is a challenging endeavor due to the fact that fires may be tens or hundreds of thousands of acres in size and hundreds of miles from airstrips or park facilities. These characteristics favor the use of remotely sensed data for burn severity mapping. The NPS and USGS are using Landsat satellite imagery as a data source for the mapping (Figure 5). Based on methods developed by Key and Benson (2004, in press), GIS burn severity layers are generated by applying the Normalized Burn Ratio (NBR) to pre- and post-fire Landsat imagery. The Normalized Burn Ratio uses data from Landsat bands 4 and 7, the two bandwidths that show the greatest response to burning (Figure 6), to generate an index of burn severity. The ratio is calculated as follows: NBR = (TM Band 4 –TM Band 7) / (TM Band 4 + TM Band 7).
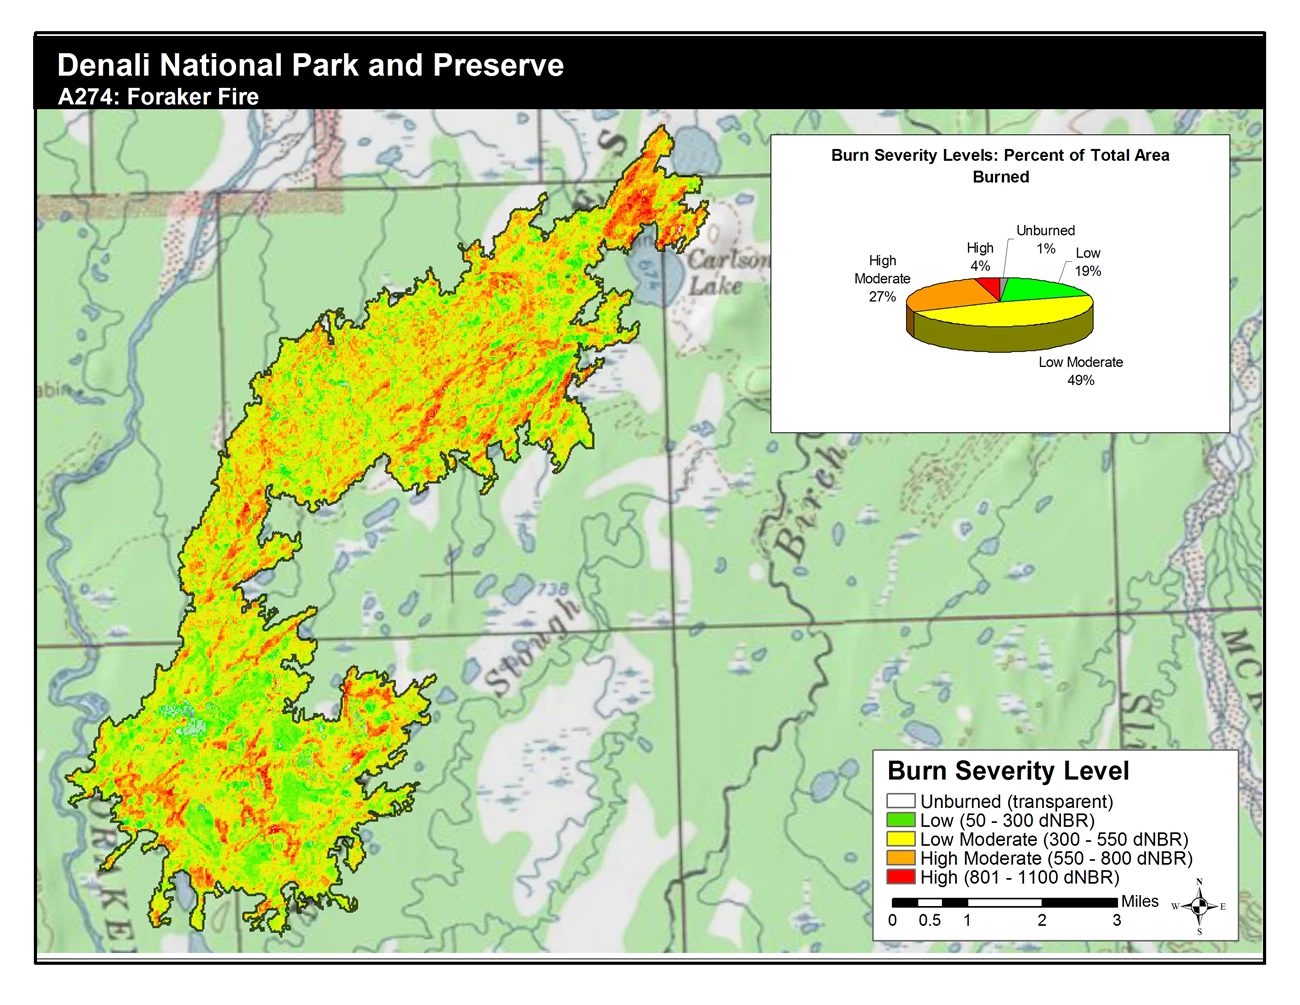
The Normalized Burn Ratio is calculated for both pre- and post-fire Landsat scenes. A final Differenced NBR (dNBR) dataset is derived by subtracting the post-fire ratio from the pre-fire ratio: dNBR = NBRprefire – NBRpostfire. The dNBR generates a continuous index of burn severity, from unburned to severely burned, with possible values ranging between -2000 and +2000. Generally, a threshold exists between about -100 and +150 dNBR units that marks an approximate breakpoint between burned and unburned areas. Areas with dNBR values below this threshold are unburned; areas with dNBR values above the thresh-old are burned. Increasing dNBR values correspond to increased burn severity (Figure 7).
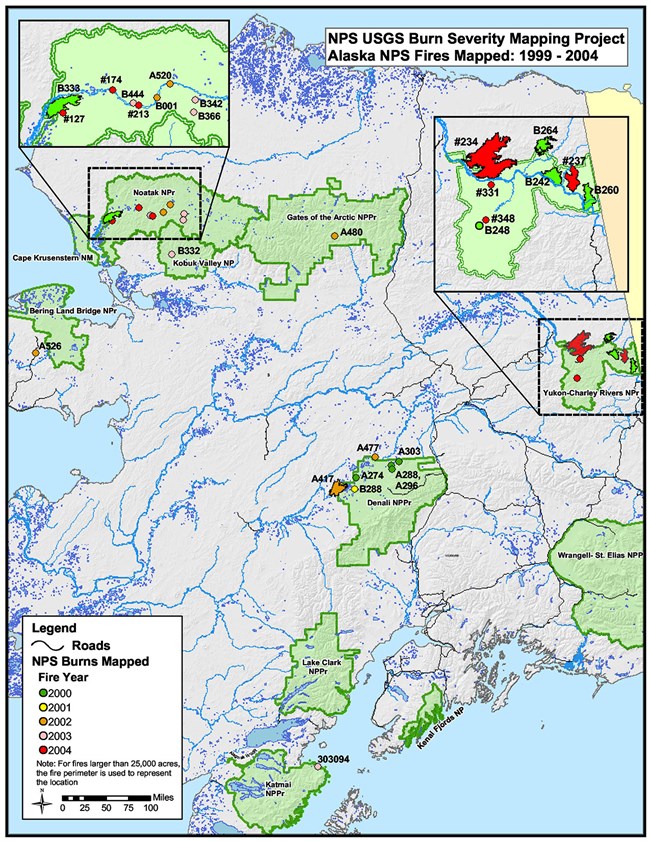
Burn severity data sets have been generated for all large fires on NPS lands in Alaska as part of the NPS-USGS National Burn Severity Mapping Project since 1999. As part of this project, the NPS Alaska Region Fire Management Program notifies the EROS Data Center (EDC) of burns that it would like mapped. The EDC acquires and process-es appropriate pre- and post-fire Landsat imagery in order to generate burn severity products including: Geographic Informa-tion Systems (GIS) grid format dNBR burn severity data set, satellite-derived final fire perimeter, pre- and post-fire Landsat imagery, and associated metadata. Burn severity data sets have been developed for 27 fires occurring in six different Alaska NPS units between 1999 and 2004 (Table 1, Figure 9). Additional fires on Bureau of Land Management and U.S. Fish and Wildlife Service lands have also been mapped.
Field Measures of Severity: The Composite of Burn Index
Composite Burn Index (CBI) plot methods were developed to validate the accuracy and applicability of mapping burn severity with remotely sensed data (Key and Benson 2004, in press). NPS fire management staff have installed 286 Composite Burn Index plots in 10 fires occurring in Yukon-Charley Rivers National Preserve, Denali National Park and Preserve, Noatak National Preserve, and near Bering Land Bridge National Preserve.The burn severity of a plot is assessed by scoring the degree of change from the pre-burn to the post-burn state for variables in five vegetation/substrate strata: 1) substrate layer, 2) herbaceous/low shrub and small tree layer, 3) tall shrubs/sapling trees, 4) intermediate trees, and 5) large trees. A score ranging from 0.0 to 3.0 is recorded for each variable, where 0 indicates unburned and 3 indicates the highest burn severity (i.e. the component has either been completely consumed or radically changed by fire). As an example, crews categorize the change caused by fire to the duff layer with possible options being: unchanged (0); light char (1); 50% loss with deep char (2); or consumed (3). In all, up to 22 severity scores are recorded for a variety of variables, such as soil cover/color change, duff and litter consumption, percent of colonizers, percent of altered foliage, percent of canopy mortality, etc. These scores are then averaged to yield CBI ratings for the understory, overstory, and the total plot. The overall CBI plot score is compared with the satellite measure of severity at that location to determine the degree of correlation, and to help determine thresholds for levels of burn severity.
Correlation Between Field and Satellite Measures of Burn Severity
Linear regression analysis was used to assess the relationship between satellite-derived measures of severity as determined by the Differenced Normalized Burn Ratio (dNBR) and ground measures of burn severity as determined by the Composite Burn Index (CBI). The relationship between dNBR and CBI values was examined in eight separate instances, as determined by fire location, fire year, and the Landsat scene pairs that were used in the analysis (Table 2).In order to assess the broad scale appli-cation of burn severity mapping, a single analysis of all 286 CBI plots and satellite burn severity values, measured across ten different fires, three parks, and over a span of four years was completed. The linear regression showed a positive correlation between ground and remote sensing meas-ures of burn severity and a good fit with a R2 value of 0.7024 (Figure 8). These results demonstrate that the dNBR is a suitable measure and predictor of burn severity in Alaska national parks.
| NPS Unit | Year | Fire Name | Fire Number | Fire Size (acres) |
|---|---|---|---|---|
| Yukon-Charley National Preserve (YUCH) | 1999 | Witch | B242 | 46,956 |
| 1999 | Beverly | B248 | 20,164 | |
| 1999 | Jessica | B260 | 48,442 | |
| 1999 | Pingo | B264 | 38,174 | |
| 2004 | Essie Creek | #348 | 911 | |
| 2004 | Nation River | #237 | 66,832 | |
| 2004 | Edwards Creek | #234 | 268,520 | |
| 2004 | Woodchopper Creek | #331 | 14,905 |
| NPS Unit | Year | Fire Name | Fire Number | Fire Size (acres) |
|---|---|---|---|---|
| Noatak National Preserve (NOAT) | 1999 | Uvgoon 2 | B333 | 88,497 |
| 2002 | Cottonwood Bar | A520 | 13,556 | |
| 2002 | Uyon Lakes | B001 | 430 | |
| 2003 | Okoklik Lake | B342 | 1,102 | |
| 2003 | Aklumayuak Creek | B366 | 289 | |
| 2003 | Grand Canyon | B444 | 115 | |
| 2004 | Uvgoon Creek | #127 | 11,231 | |
| 2004 | Poktovik Creek | #174 | 289 | |
| 2004 | Sisiak Creek | #213 | 333 |
| NPS Unit | Year | Fire Name | Fire Number | Fire Size (acres) |
|---|---|---|---|---|
| Denali NP and Preserve (DENA) | 2000 | Foraker | A274 | 17,956 |
| 2000 | Otter Creek | A288 | 11,576 | |
| 2000 | Upper Otter Creek | A296 | 4,726 | |
| 2000 | Chitsia | A303 | 9,330 | |
| 2001 | Herron River | B288 | 6,238 | |
| 2002 | Moose Lake | A417 | 117,920 | |
| 2002 | John Hansen Lake | A477 | 25,752 |
| NPS Unit | Year | Fire Name | Fire Number | Fire Size (acres) |
|---|---|---|---|---|
| Gates of the Arctic NP and Preserve (GAAR) | 2002 | Dawn Creek | A480 | 2,548 |
| NPS Unit | Year | Fire Name | Fire Number | Fire Size (acres) |
|---|---|---|---|---|
| Katmai NP and Preserve (KATM) | 2003 | West Kamishak Bay | 303094 | 1,285 |
| NPS Unit | Year | Fire Name | Fire Number | Fire Size (acres) |
|---|---|---|---|---|
| Kobuk Valley NP | 2003 | Salmon River | B332 | 546 |
| NPS Unit | Fire Name | Fire Number | Fire Year | #of CBI Plots | R² |
|---|---|---|---|---|---|
| YUCH | Witch, Jessica | B242, B260 | 1999 | 79 | 0.75 |
| YUCH | Beverly | B248 | 1999 | 40 | 0.46 |
| DENA | Otter Creek, Chitsia | A288, A303 | 2000 | 35 | 0.76 |
| DENA | Foraker | A274 | 2000 | 24 | 0.76 |
| DENA | Herron River | B288 | 2001 | 25 | 0.84 |
| NOAT | Cottonwood Bar | A520 | 2002 | 18 | 0.78 |
| NOAT | Uyon Lakes | B001 | 2002 | 18 | 0.80 |
| Non-NPS Unit (near BELA) | Milepost 85 | A526 | 2002 | 47 | 0.82 |
Ecological Effects and Applications of Burn Severity
Burn severity mapping captures the heterogeneous nature of fire, and offers a more complete description and quantification of a fire’s effect on the landscape. The boreal forest and tundra of Alaska are fire-adapted ecosystems, and they are characterized by a mosaic of different aged landscapes that are maintained by fire. In this system, burn severity strongly influences vegetation pat-terns and succession after fire. Since many of the plant species are rooted in the organic forest floor mat, the amount of consumption of the organic mat will determine whether vegetation regeneration occurs through seeding or re-sprouting post-fire (Viereck and Schandelmeier 1980).If fire severity is low to moderate, above-ground portions of plants may be top-killed, but minimal organic mat or duff is burned. Regeneration can occur quickly through re-sprouting from roots and stems for species such as aspen, paper birch, Labrador tea, willow, resin birch, rose, fire-weed, tussocks, or northern blue joint grass (Foote 1983, Viereck and Schandelmeier 1980, Racine et al. 1987) (Figure 3). On the other hand, severe burns will consume most of the organic layer and kill most of the underground root structure of shrubs and herbaceous plants, so that reproduction will occur primarily by seed (Figure 4). As a result, severity will influence the plant species composition at a site.

Burn severity maps provide baseline information that can be used for management, monitoring, modeling, and research. Currently, burn severity maps are used to refine and improve final fire perimeters by fire management. Burn severity maps also provide a means to identify unburned islands within fire perimeters, which can be used to determine whether study sites within a fire perimeter have burned and the degree of impact. Severity data will be a key explanatory variable for park staff who monitor vegetation, wildlife, water quality, and permafrost. Resource and fire staff are utilizing burn severity maps to update land-cover vegetation and fuels maps to reflect changes from recent fires. These predictive maps have been used in Yukon-Charley Rivers National Preserve to model changes in bird habitat utilization and will be used to model fire behavior and fire spread for fire management. The severity of fires plays a role in permafrost degradation, nutrient cycling, and water quality parameters (Dyrness et al. 1986, Yoshikawa et al. 2003). Assessing permafrost degradation is a critical component in determining the potential for soil erosion and run-off problems; burn severity maps are used to assess the impact of fire to permafrost. Finally, burn severity mapping provides baseline information that can be used to assess the effects of climate change over time.
Under the USGS-NPS National Burn Severity Mapping Project, burn severity mapping and field validation are occurring in parks throughout the entire NPS system. This partnership has produced burn severity datasets for more than 150 fires occurring in nearly 60 NPS units. All datasets are posted on the USGS-NPS National Burn Severity Mapping Project website.
Dyrness, C.T., L.A. Viereck, and K.Van Cleve. 1986.
Fire in taiga communities of Interior Alaska.
In Forest Ecosystems in the Alaskan Taiga: a Synthesis of Structure and Function, edited by K. Van Cleve, F.S. Chapin III, P.W. Flanagan et al. Springer-Verlag. New York.
Foote, M.J. 1983.
Classification, description, and dynamics of plant communities after fire in the taiga of interior Alaska. U.S. Forest Service, Research Paper PNW-307, Pacific Northwest Forestry and Range Experimental Station. Portland, OR.
Joly, K., L. Adams, B. Dale, and W. Collins. 2002.
Evaluating the impacts of wildland fires on caribou in Interior Alaska.
Arctic Research 16: 63-67.
Key, Carl H., and Nate C. Benson. (in press).
Landscape Assessment: Ground meas-ure of severity, the Composite Burn Index; and Remote sensing of severity, the Normalized Burn Ratio.
In FIREMON: Fire Effects Monitoring and Inventory System, edited by D.C. Lutes, R.E. Keane, J.F. Caratti, C.H. Key, N.C. Benson, and L.J. Gangi.
General Technical Report. RMRS-GTR-XXX. U.S. Department of Agriculture, Forest Service, Rocky Mountain Research Station. Ogden, UT.
Key, Carl H., and Nate C. Benson. 2004.
Landscape Assessment: Sampling and Analysis Methods.
Retrieved October 8, 2004 from USGS EROS Data Center website
Paragi, W.N., W.N. Johnson, D.D. Katnik, and A.J. Magoun. 1996.
Marten selection of postfire seres in the Alaskan taiga.
Canadian Journal of Zoology 74(12): 2226-2237.
Racine, C.H., L.A. Johnson, and L.A. Viereck. 1987.
Patterns of vegetation recovery after tundra fires in northwestern Alaska, U.S.A.
Arctic and Alpine Research 19(4): 461-469.
Swanson, Shelly A. 1996.
Small Mammal Populations in Post-Fire Black Spruce (Picea mariana) Seral Communities in the Upper Kobuk River Valley, Alaska. Gates of the Arctic National Park & Preserve. Gates of the Arctic National Park offices, ARL Fires, DSC-TIC.
Viereck, Leslie A., and Linda A. Schandelmeier. 1980.
Effects of fire in Alaska and adjacent Canada - a literature review. BLM-Alaska Technical Report 6, BLM/AK/TR-80/06.
Yoshikawa, Kenji, William R. Bolton, Vladimir E. Romanovsky, Masami Fukuda, and Larry D. Hinzman. 2003.
Impacts of wildfire on the permafrost in the boreal forests of interior Alaska. Journal of Geophysical Research 108, No D1, 8148.
