Take a moment to imagine a misty June morning in Denali National Park. Now place yourself within the aural context: From all around you comes the spiraling song of Swainson’s thrush, the mirror-image retorts of contested white-crowned sparrows, and the bell-like ringing of a dark-eyed junco. These, and the vocalizations of other species too distant to identify, combine to form the ambience of an open spruce woodland habitat.
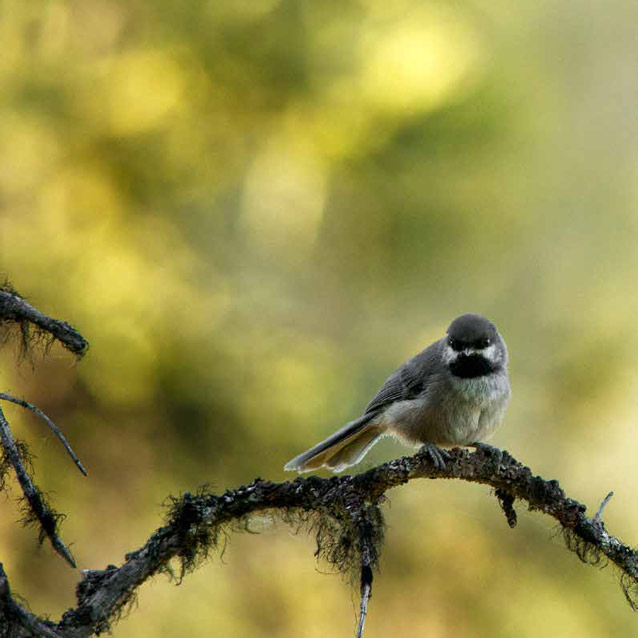
A boreal chickadee
It may surprise you to find the National Park Service recognizes and protects these songs as part of the entirety of the natural acoustic environment. Direction for management of the natural acoustic environment is represented in 2006 Management Policy 4.9: “The Service will restore to the natural condition wherever possible those park soundscapes that have become degraded by unnatural sounds (noise), and will protect natural soundscapes from unacceptable impacts” (NPS 2006a).
The initial push for Denali to inventory the acoustic environment was Director’s Order 47 (DO-47; NPS 2000). Robert Stanton issued the order in 2000, stating that “natural sounds are intrinsic elements of the environment that are often associated with parks and park purposes…They are inherent components of ‘the scenery and the natural and historic objects and the wild life’ protected by the NPS Organic Act.” DO-47 directed park managers to “(1) measure baseline acoustic conditions, (2) determine which existing or proposed human-made sounds are consistent with park purposes, (3) set acoustic management goals and objectives based on those purposes, and (4) determine which noise sources are impacting the park and need to be addressed by management.” Furthermore, it requires park managers to “(1) evaluate and address self-generated noise, and (2) constructively engage with those responsible for other noise sources that impact parks to explore what can be done to better protect parks” (NPS 2000).
NPS Photo
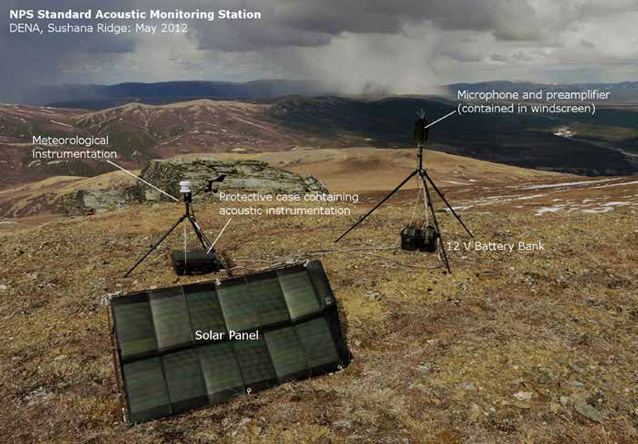
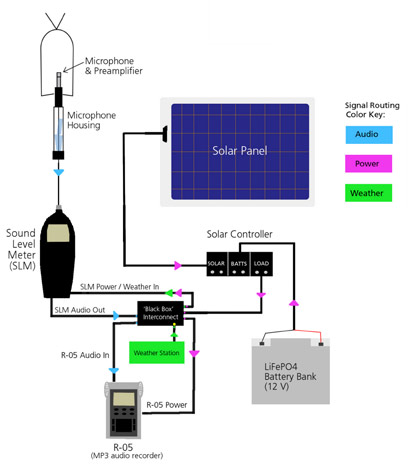
Since 2000, the Natural Sounds and Night Skies Division of the National Park Service has sought to improve the ability of parks to comply with these directions. Developing a method to collect relevant information on the acoustic environment was the first challenge. In the absence of readily-available commercial products for acoustic monitoring, the NPS has led the way for land management agencies by developing an autonomous system that can provide both American National Standards Institute (ANSI) certified acoustic levels (i.e., numeric measurements of sound pressure level in decibel units,) and audio recordings (i.e., sound that one can listen back to in headphones.) ANSI also recommends the collection of meteorological data concurrent with measurements of sound pressure level. Thus, a simple weather station incorporating wind speed, wind direction, temperature, and relative humidity is also part of the acoustic monitoring station. Figure 2 shows an external photograph of a typical station. A simplified schematic of the internal signal routing is presented in Figure 3.
Since 2006, Denali has been using such automated acoustic equipment to conduct a spatially balanced inventory of the park’s acoustic environment on a grid at the 6.2 x 6.2 mile scale (10 x 10 kilometers.) The effort is part of the Central Alaska Network long-term monitoring program. At present, staff members have collected data at 85 unique sites, making the dataset the most expansive in the nation. Detailed descriptions of the soundscape at each of these sites can be found in annual Denali soundscape monitoring reports (Withers and Hults 2006; Withers 2010; Withers 2011; Withers 2012; Withers and Betchkal 2013; Betchkal 2013a; and Betchkal 2013b). We can infer much about Denali’s natural acoustic environment from such data. It is especially enticing to apply these data to the study of soundscape ecology, a field that has advanced rapidly in the last few decades. Soundscape ecology is the interface
NPS Image
As such, it is concerned with the total assemblages of sound across a range of spatial and temporal scales. Contrast this with the role that sound recording has played historically in the study of bioacoustics: short clips documenting specific instances of communication or behavior in one or a few species.
Though assemblages of short recordings or species-specific studies are valuable scientific information, the recent transition in scope reflects the increasing ability of sound recording devices to address previously unapproachable community scale questions.
One thing is clear, at least. Since their inception in 1877, sound recording devices have become steadily more reliable as instruments of field science. More than ever, they are compact and resistant to the elements. They reproduce signals with greater fidelity. Their demand for power has dropped precipitously, while at the same time their memory capacity has expanded. Improved computation and file transfer speed has contributed to the feasibility of working with and archiving large audio recordings.
Ecologists have responded to these advances by rigorously testing the application of such systems. As early as 1957, ornithologists were using sound recording devices to estimate the density of nocturnally migrating songbirds (Graber and Cochran 1959). However, such early examples of audio-based avian ecology techniques are somewhat rare. It was not until the digital era of the 1990s that the scientific community began to fully realize audio recorders as tools. For instance, researchers recognized that audio recordings offer a permanent record that could be valuable in situations where many vocalizations overlap, allowing an analyst to listen to the same sound repeatedly in an effort to increase accuracy (Haselmayer and Quinn 2000). Other researchers saw the objectivity of microphones and the ability to archive audio data among the benefits of the technique (Hobson et al. 2002). The National Park Service itself has studied the effectiveness of acoustic monitoring equipment to supplement traditional avian point counts for over a decade (Daw and Ambrose 2003).
Denali Soundscape
Each point represents an area monitored by a soundstation. Click a point to read about the acoustic data we recorded and to see an image of the area. The larger, red stars indicate areas where sound recordings are available, in addition to the other data.
Research has shown that traditional metrics like species richness can be determined effectively from sound recordings (Wimmer et al. 2013); while others have envisioned methods for deriving density estimates from audio techniques (Marques et al 2013). Some researchers have proposed new metrics calculated directly from the audio data, such as the Acoustic Complexity Index (ACI). ACI quantifies the variability contained within the sound of diverse assemblages of birds (Pieretti et al. 2011). Changes in variability offer a rapid indirect assay of richness or biological behavior through time.
Many of these research projects are inextricable from another topic suitable to study via sound recording: human noise. An eagerness to understand the effects of noise on avifauna has led many people to learn and use acoustic methods. Again, over time research has trended away from a short-term organismal-scale focus toward the study of broader scale effects. Instead of focusing on behavioral reactions of an individual to intense noise, researchers now recognize that chronic noise at low-to-moderate levels generally has more impact to wildlife populations over the long term (Vistnes and Hellemann 2008). Studies show that noise may displace animals from otherwise suitable habitat, or force them to reallocate energy from foraging to anti-predator behavior (Barber et al. 2010). If they don’t—or can’t—relocate, they risk prolonged exposure to noise, a well-recognized physiological stressor. Noise pollution has been shown to change avian communities and species interactions throughout an area (Francis et al. 2009), as well as landscape patterns of habitat use and nest success (Francis et al. 2011). Furthermore, in a study controlling for other effects of roads, migrating birds specifically avoided the sound of traffic noise and were less abundant in areas where it was prevalent (McClure et al. 2013). At the contemporary cutting edge of audio technology is the ability to automatically detect and identify sounds within a recording. Software such as Raven (Cornell Lab of Ornithology) and SongScope (Wildlife Acoustics, Inc.) are among the most powerful and user-friendly tools of this kind currently available to science. Though completely automated detection is not feasible at this time, it was within the Raven computing environment that Denali decided to approach a retrospective analysis of soundscape recordings as part of our park-wide avian inventory. Traditionally, we conduct avian inventories by sending research teams into the field, where they use a variety of survey methods to collect data on the presence of species. Now we are combining the use of such traditional methods as point counts with audio recordings to complete our avian inventory.
NPS Photo
Methods
The first step in using recordings involved assessing the available data. We first determined that only continuous MP3 audio was useful for identification purposes. This ruled out recordings made before 2010, when memory constraints limited the station to capturing only five-second audio clips every five minutes. Second, we determined that the first phase of the project should focus on the dates of the year with the most intense period of singing, historically between April 15 and June 30. This reduced the number of acoustic monitoring sites available for the inventory to a subset of 25.
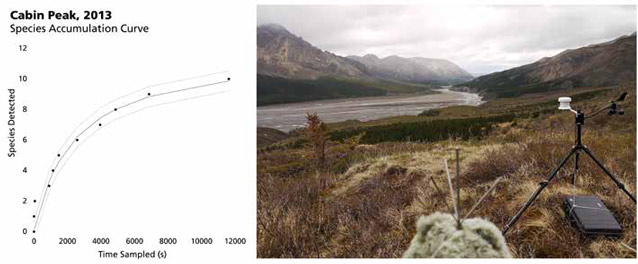
In an attempt to add value to future attempts at automatic recognition, the Denali survey implemented a computer aided detection (CAD) approach. The first step involves a carefully tuned general detector designed for passerine vocalizations. The detector runs in Raven software, and returns spectrograms of potential songs and calls. This approach is important for two reasons. First, it provides an objective basis to dismiss faint, difficult to identify signals from consideration. Second, each detection is carefully delineated in time, which can be used to quantify the sampling effort at each site. Sampling effort is the dependent variable used when plotting a species accumulation curve, a technique used to estimate species richness. (Figure 5 shows an example of a species accumulation curve for a site in Denali.)
NPS Graphics
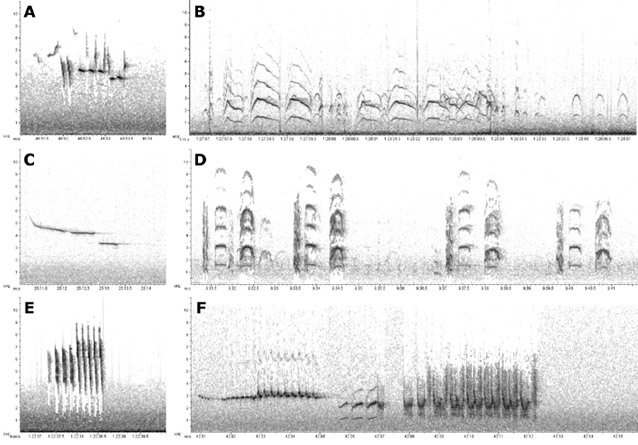
After the computer provides the list of detections, a human observer combs through the spectrograms and uses visual, auditory, and analytical tools to identify birds as accurately as possible. Because the recording is permanent, individual signals can be listened to multiple times and compared to reference recordings as time allows. This places the balance of time-cost versus accuracy on the human analyst. Maximization of such a trade-off occurs when staff are very familiar with the auditory detection of local species. Adopting such a technique might enable locally skilled ornithology technicians to continue their survey work throughout the fall and winter seasons. Composite figure 6 shows the vocalizations of several species visualized as a spectrogram in Raven. Explore additional examples from Alaska NPS units on the collaborative avian sounds website Xeno-Canto.
Future Plans
After annotating the audio records collected from 2010 through 2014, we will use the survey results to further understand the diversity of Denali’s avian communities across a variety of spatial scales and habitats. Species richness, especially, will be explored as a metric. Furthermore, staff will seek greater efficiencies in the computer aided detection process. Identifying species from the recordings is currently arduous and requires repetitive annotations. However, if we use the thousands of detections already labeled by staff to automatically identify common species, we would substantially reduce future time costs. Two approaches to leveraging existing annotations are “machine learning” and “supported decision” techniques. Machine learning – such as random forest clustering – can be used to filter out and annotate common signals (Ross and Allen 2014). The “supported decision” technique shows the analyst previously validated signals that are similar to the one they are currently viewing so they can rely on the knowledge of others to support their decision. (Truskinger et al. 2014).
The project also allows for the study of detection itself. An understanding of how the entire acoustic environment affects an observer’s ability to quantify diversity is an important consideration of any auditory-based wildlife survey. Because we use the same microphone to record audio and numeric measurements of sound pressure level, we can use the data to understand the limitations of animal detection in different acoustic environments. Once we address such scientific concerns, we will be better equipped to quantify changes in avian communities across the entire park.
References
Betchkal D. 2013a.
Acoustic monitoring report, Denali National Park and Preserve – 2011. Natural Resource Data Series. NPS/DENA/NRDS—2013/474. National Park Service. Fort Collins, Colorado. Published Report-2194377.
Betchkal D. 2013b.
Acoustic monitoring report, Denali National Park and Preserve – 2012. Natural Resource Data Series. NPS/DENA/NRDS—2013/589. National Park Service. Fort Collins, Colorado. Published Report-2204780.
Daw, S., and S. Ambrose. 2003.
Using Digital Recordings to Supplement Avian Surveys, Canyonlands National Park, 2002. Unpublished report to Canyonlands National Park. Moab: National Park Service.
Francis, C., C. Ortega, and A. Cruz. 2009.
Noise pollution changes avian communities and species interactions. Current Biology. 19.16: 1415-1419.
Francis, C., J. Paritsis, C. Ortega, and A. Cruz. 2011.
Landscape patterns of avian habitat use and nest success are affected by chronic gas well compressor noise. Landscape Ecology. 26.9: 1269-1280.
Graber, R., and W. Cochran. 1959.
An audio technique for the study of nocturnal migration of birds. The Wilson Bulletin. 220-236.
Haselmayer, J., and J. Quinn. 2000.
A comparison of point counts and sound recording as bird survey methods in Amazonian southeast Peru. The Condor. 102.4, 887-893.
Hobson, K., R. Rempel, H. Greenwood, B. Turnbull, and S. Van Wilgenburg. 2002.
Acoustic surveys of birds using electronic recordings: new potential from an omnidirectional microphone system. Wildlife Society Bulletin. 709-720.
Marques, T., L. Thomas, S. Martin, D. Mellinger, J. Ward, D. Moretti, D. Harris, and P. Tyack. 2013.
Estimating animal population density using passive acoustics. Biological Reviews. 88.2: 287-309.
McClure, C., H. Ware, J. Carlisle, G. Kaltenecker, and J. Barber. 2013.
An experimental investigation into the effects of traffic noise on distributions of birds: avoiding the phantom road. Proceedings of the Royal Society B: Biological Sciences. 280.1773: 20132290.
National Park Service (NPS). 2000.
Soundscape Preservation and Noise Management. Director’s Order #47. U.S. Department of the Interior. Washington, D.C.: National Park Service.
National Park Service (NPS). 2006a.
Soundscape Management in Management Policies 2006. Management policy 4.9. U.S. Department of the Interior. Washington, D.C.: National Park Service.
National Park Service (NPS). 2006b.
Denali National Park and Preserve Final Backcountry Management Plan, Environmental Impact Statement. De-nali Park: National Park Service.
Pieretti N., A. Farina, and F. Morri. 2011.
A new methodology to infer the singing activity of an avian community: the Acoustic Complexity Index (ACI). Ecological Indicators. 11: 868-873.
Pijanowski, B., et al. 2011.
Soundscape ecology: the science of sound in the landscape. BioScience. 61.3: 203-216.
Ross, J., and P. Allen. 2014.
Random forest for improved analysis efficiency in passive acoustic monitoring. Ecological Informatics. 21: 34-39.
Truskinger, A., M. Towsey, and P. Roe. 2014.
Decision support for the efficient annotation of bioacoustic events. Ecological Informatics. 25: 14-21.
Vistnes, I., and C. Nellemann. 2008.
The matter of spatial and temporal scales: a review of reindeer and caribou response to human activity. Polar Biology. 31.4: 399-407.
Wimmer, J., M. Towsey, P. Roe, and I. Williamson. 2013.
Sampling environmental acoustic recordings to determine bird species richness. Ecological Applications. 23.6: 1419-1428.
Withers, J., and C. Hults. 2006.
Denali National Park and Preserve soundscape annual report 2006. Unpublished. Denali Park: National Park Service.
Withers, J. 2010.
Acoustic monitoring report, Denali National Park and Preserve—2008. Natural Resource Data Series NPS/CAKN/NRDS—2010/091. Fort Collins: National Park Service.
Withers, J. 2011.
Acoustic monitoring report, Denali National Park and Preserve—2007. Natural Resource Data Series NPS/CAKN/NRDS—2011/136. Fort Collins: National Park Service.
Withers, J. 2012.
Acoustic monitoring report, Denali National Park and Preserve—2009. Natural Resource Data Series NPS/DENA/NRDS—2012/271. Fort Collins: National Park Service.
Withers, J., and D. Betchkal. 2013.
Acoustic monitoring report, Denali National Park and Preserve—2010. Natural Resource Data Series NPS/DENA/NRDS—2013/441. Fort Collins: National Park Service
Part of a series of articles titled Alaska Park Science - Volume 14 Issue 2: Birds of Alaska's National Parks.
Last updated: July 17, 2018
