In 1898, thousands of Americans and others rushed north in search of newly discovered gold in the Yukon Territory. The standard route took them by boat to the head of the Taiya Inlet and the boomtown of Dyea, but from here they had to trek into the wilderness, up and over Chilkoot Pass and on to the gold fields of the Yukon. Klondike Gold Rush National Historical Park (Klondike) commemorates this mass movement of humanity and this important period of North American history.
NPS Images
More recently, Klondike has been the subject of another sort of human migration. And once again, most of these people are arriving by boat. But these visitors are “tourists” and they are traveling on cruise ships. Alaska has become a major destination for cruise ships, and the port town of Skagway is on the itinerary of most of these ships. It’s not unusual for several cruise ships a day to call at Skagway, with some of these ships carrying as many as several thousand visitors.
While most visitors to Klondike remain in and around the historic town of Skagway, the developed part of the park, increasing numbers are venturing further afield to the Dyea portion of the park. During the gold rush period, the population of the town of Dyea exploded to ten thousand, but population declined just as quickly when the gold rush period came to a close. Very little physical evidence of the town remains as the site has retreated to a wilderness-like condition; evidence of previous human use is virtually invisible to the untrained eye, offering current visitors the feel of wilderness. Although the Dyea portion of the park is not designated wilderness under the provisions of the Wilderness Act, it might best be considered wilderness with a lower case “w.” The Dyea portion of the park includes the trailhead of the famous Chilkoot Trail, the thirty-three-mile route over Chilkoot Pass that led to the Yukon gold fields. This is now a popular backpacking trail. Most visitors to the Dyea portion of the park are participants on short commercial “excursions” sold by cruise ship companies and conducted by local entrepreneurs.
Because of increasing demand for commercial use of the wilderness-like area of Dyea, Klondike is preparing a new plan to manage this use. Among other issues, the plan will address the carrying capacity of the Dyea area for recreation. To help inform this plan, a series of visitor surveys were conducted to address this issue. This article describes these studies.
NPS Images
The Studies
The National Park Service (NPS) has adopted an approach to determining carrying capacity called Visitor Experience and Resource Protection (National Park Service 1997; Manning 2001; Manning 2007). This framework relies on formulation of standards of quality. Standards of quality define the minimum acceptable condition of park resources and the visitor experience (Manning 2011). The visitor surveys at Klondike were commissioned to help formulate standards of quality for the Dyea area. Use of the Dyea area is comprised of four types of visitors: (1) commercial “hike and float” trips (visitors hike the first mile of the Chilkoot trail and return to Dyea by raft on the Taiya River); (2) commercial bicycle tours (a guided bike tour of the Dyea area); (3) commercial “horse adventure” tours (a guided horseback ride in the Dyea area); and (4) independent visitors (noncommercial visitors, most of whom participate in a ranger-guided hike). Similar questionnaires were administered to all four types of visitors in the summers of 2010 and 2011. The overall response rate was 73.2 percent and yielded 614 completed questionnaires.

NPS Images
Crowding is an important measure of the quality of the visitor experience in parks and wilderness, and is often used as an important measure of the experiential component of carrying capacity (Vaske & Shelby 2008; Manning 2011). Therefore, measures of crowding (meaning the number of other visitors encountered) was a focus of the Dyea studies.
NPS Images
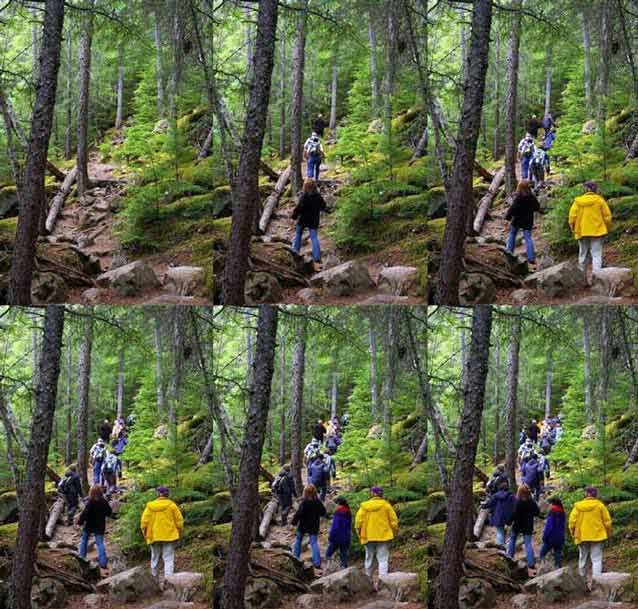
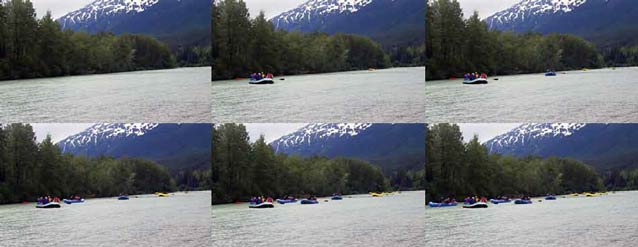
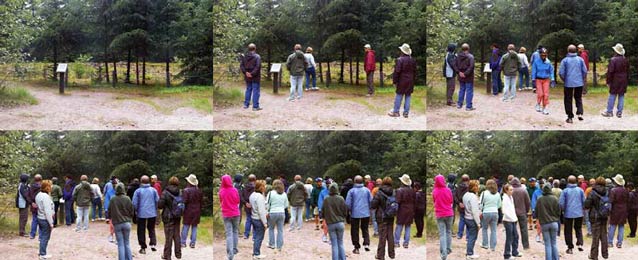
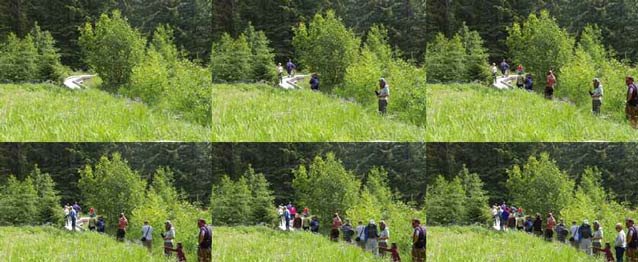
Questionnaires administered to all four categories of visitors included batteries of questions addressing crowding-related standards of quality. For example, the survey of hike and float visitors included a set of visual simulations of a range of visitors at two key locations – hikers on the Chilkoot Trail (Figure 1) and groups of rafters on the Taiya River (Figure 2).
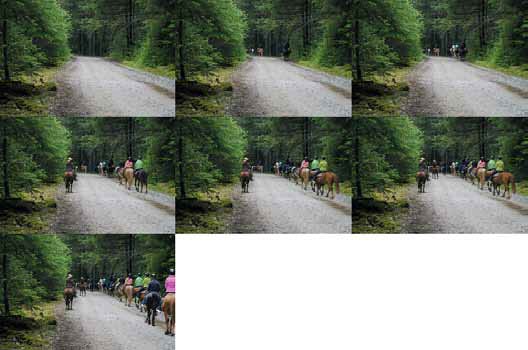
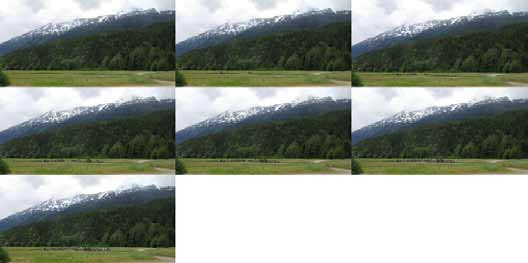
Respondents were also asked to report (1) the photo showing the number of visitors they would prefer to see (“preference”); (2) the photo showing the number of visitors that was so high they would no longer visit the area (“displacement”); (3) the photo showing the highest number of visitors the NPS should allow (“management action”); and (4) the photo showing the number of visitors they saw (“typically seen”). The survey of bicycle tour visitors and independent visitors included sets of study photos for three sites (the False Front (Figure 3), the Warehouse (Figure 4), and Nelson Slough Bridge (Figure 5)). The survey of horse tour visitors included sets of study photos for two sites: (the road (Figure 6) and tidal flats (Figure 7)).
NPS Images
Study Findings
Findings for crowding-related standards of quality are shown in the graphs in figure 8 and are summarized in table 1. The figures graph mean acceptability ratings for the study photos. In all cases, increasing numbers of visitors are rated as increasingly unacceptable. In figure 3 (hike and float visitor ratings of hikers on the Chilkoot Trail), mean acceptability ratings fall out of the acceptable range and into the unacceptable range at ten people. This threshold represents a potential standard of quality. However, as shown in the first row of table 1, visitors on the hike and float trip reported that, on average, they preferred to see about five people, they would be displaced if they saw about fifteen people, they think the NPS should allow a maximum of about eleven people, and they typically see about five people. These findings, from five to fifteen people, represent a range of potential standards of quality for crowding.
NPS Images
Several other findings have potentially important management implications. Standards of quality were also measured for tour group size, length of tour, and the number of other tour groups seen; application of these findings can help ensure high quality commercial tours. Visitors on commercial tours were nearly always cruise ship passengers (91.9 percent to 97.4 percent across the three types of tours) while independent visitors were rarely cruise ship passengers (6.7 percent). While there were relatively few statistically significant differences between commercial and independent visitors, independent visitors were sometimes less tolerant of higher use levels. Only a minority of commercial visitors knew that Dyea is managed by the NPS before they arrived at the site, and learned about this from their tour guide (61.5 percent to 78.2 percent across the three types of tours). Moreover, most commercial visitors (77.7 percent to 85.3 percent) do not stop at the park’s visitor center in Skagway before traveling to Dyea, while most independent visitors (68.5 percent) do. Length of stay at Dyea is quite short, averaging between two and three hours.
Table 1. Summary table of crowding-related standards of quality for each of the sites and visitor groups.
| Location | Acceptability | Preference | Displacement* | Action** | Typically Seen |
|---|---|---|---|---|---|
| Chilkoot Trail (people) | 10 | 4.9 | 15.2 | 10.6 | 5.1 |
| Taiya River (rafts) | 5.1 | 1.8 | 7.4 | 4.7 | 1.2 |
| False Front (people) | 12.9 | 5.8 | 22.1 | 13.3 | 5.4 |
| Warehouse (people) | 12.6 | 5.5 | 19.4 | 13.7 | 5.0 |
| Nelson Slough Bridge (people) | 12.4 | 4.7 | 15.4 | 10.9 | 5.4 |
| False Front (people) | 15.1 | 5.5 | 19.6 | 14.2 | 6.2 |
| Warehouse (people) | 14.7 | 5.6 | 20.2 | 14.0 | 5.5 |
| Nelson Slough Bridge (people) | 12.6 | 5.2 | 15.5 | 10.2 | 4.9 |
| Road (people) | 16.6 | 7.5 | n/a | n/a | n/a |
| Tidal Flats (people) | 13.8 | 6.7 | n/a | n/a | n/a |
* Displacement is defined as the level of use that would cause visitors to not return to the areas they are visiting. The estimates in Table 1 are underestimated since respondents were given the option to indicate that none of the use levels presented would be high enough to prevent them from returning.
**Management action is the point at which respondents feel that use levels are high enough to require the NPS to limit use of the area. The estimates in Table 1 are underestimated since respondents were given the options to indicate that none of the use levels presented would be high enough to restrict use, or that use should never be restricted.
NPS Images
Conclusions
The surveys at Dyea offer insights into visitors to this area of the park and have a number of management implications. For example, data on visitor perceptions of crowding can help guide decisions about appropriate visitor use levels in the Dyea portion of the park. This is especially important given the large and growing levels of use at Klondike, the most heavily visited unit of the national park system in Alaska. Respondents to the four surveys conducted as part of this study generally reported that they saw about the number of visitors they prefer to see, but given trends in use, this is likely to change without explicit management attention. While study data suggest a range of potential crowding-related standards of quality (from preference to displacement), the NPS is setting crowding-related standards of quality at the low (“preference”) end of this range. This will maintain a very high quality experience and will offer a type of recreation opportunity that is in contrast to the often very high density visitor experience in the developed Skagway portion of the park. This would contribute to a spectrum of visitor experiences that is often desirable in national parks and related recreation areas (Manning 2011).
Park managers should take note of the potentially important role that commercial tour operators play in the visitor experience at Dyea. The vast majority of commercial tour visitors weren’t even aware that the area is part of the national park system (until they were told by tour guides). Moreover, the majority of commercial tour visitors had not stopped at the park’s visitor center before traveling to Dyea. Commercial tour guides are the primary source of information for the vast majority of visitors to the Dyea area, and the NPS should work closely with these guides to help ensure that visitors are given the information they should have to fully enjoy their experience and appreciate and protect this area.
Perhaps most importantly, the studies at Dyea suggest the importance of planning for commercial use of national parks, even wilderness (or wilderness-like) areas. The wilderness portions of national parks have been important destinations of commercial tour groups such as Outward Bound and the National Outdoor Leadership School for many years. But the experience at Klondike illustrates that commercial tour visitors can quickly become a major user of these areas and that this use is quite different from conventional wilderness and backcountry recreation (Abbe & Manning 2007). This use should be managed through concession and commercial use plans that guide appropriate levels and types of use and the NPS should work closely with commercial operators to ensure that visitors have a high quality experience and that visitor behavior is fully respectful of the wilderness/wilderness-like character of these areas. Klondike offers a model of this type of planning and management.
References
Abbe, D., and R. Manning. 2007.
Wilderness day use: Patterns, impacts, and management. International Journal of Wilderness 13, 21-25.
National Park Service. 1997.
VERP: The Visitor Experience and Resource Protection (VERP) framework – A handbook for planners and managers. Denver: Denver Service Center.
Manning, R. 2001.
Visitor Experience and Resource Protection: A framework for managing the carrying capacity of national parks. Journal of Park and Recreation Management 19, 93-108.
Manning, R. 2007.
Parks and carrying capacity: Commons without tragedy. Washington, D.C.: Island Press.
Manning, R. 2011.
Studies in outdoor recreation: Search and research for satisfaction. Corvallis: Oregon State University Press.
Vaske, J., and B. Shelby. 2008.
Crowding as a descriptive indicator and an evaluative standard: Results from 30 years of research. Leisure Sciences 30, 111-126.
Part of a series of articles titled Alaska Park Science - Volume 13 Issue 1: Wilderness in Alaska.
Last updated: August 7, 2015
