The Kahiltna Glacier in Denali National Park and Preserve is best known to mountain climbers as a starting point when summiting Mount McKinley, the highest peak in North America. Visitors on flightseeing tours are fascinated by its classic moraine stripes and dramatic icefalls. To scientists, however, the Kahiltna Glacier represents a prime opportunity to examine the effects of a warming climate on Alaska glaciers.
Introduction
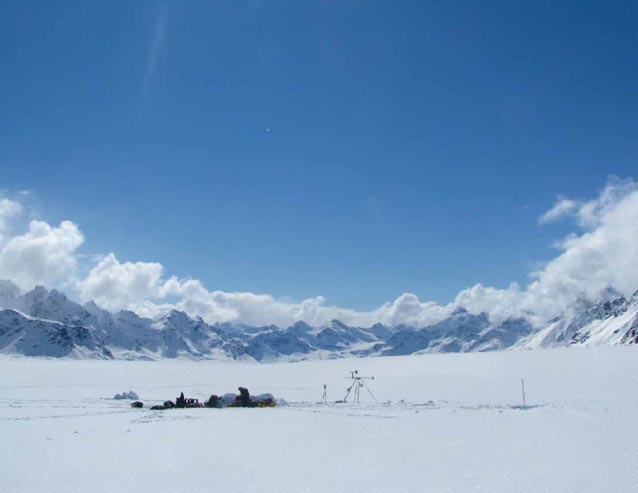
NPS Photo
The Kahiltna Glacier in Denali National Park and Preserve (DNPP) (Figure 1) is best known to mountain climbers as a starting point when summiting Mount McKinley, the highest peak in North America. Visitors on flightseeing tours are fascinated by its classic moraine stripes and dramatic icefalls. To scientists, however, the Kahiltna Glacier represents a prime opportunity to exam-ine the effects of a warming climate on Alaska glaciers.
In 1991, the National Park Service partnered with researchers to establish a monitoring program on the Kahiltna Glacier which provided valuable long-term data, albeit from a single location. To better represent the vast extent of the glacier, we expanded observations during 2010 and 2011, and supplemented with newly-available airborne and satellite data that will allow us to monitor regions of the glacier inaccessible by conventional field methods. The goal of our work is to determine the mass balance—or mass change—of the Kahiltna Glacier
over the past several decades, comparing four of the leading mass balance methods used by glaciologists.
Study Location
The Alaska Range forms a sweeping topographic barrier to moist weather systems entering inland off the Gulf of Alaska; glaciers on the south side of the range receive more snowfall and grow significantly larger than those on the north side. The Kahiltna Glacier flows southward from the summit of Mount McKinley, at an altitude of 20,013 ft (6,100 m), to just 886 ft (270 m) above sea level at its terminus. This elevation range is thought to be the greatest of any glacier on Earth. Covering nearly 200 square miles (500 km2) with a centerline length of 44 miles (70 km), the Kahiltna Glacier is the largest glacier within the park. Together, these two characteristics—a large size and broad range of elevations—present challenges to field logistics and invite innovative approaches to integrating data from other sources.
Motivation
Glaciers throughout the world have been experienc-ing increasing rates of mass loss over the last several decades (AMAP 2010). Together, glaciers of Alaska and Canada are one of the largest contributors to changes
in Earth’s ocean volume, causing about 0.006 inches/year (0.14 mm/year) of sea level rise (Gardner et al. 2013).
Understanding the hydrochemistry of melting glaciers is important for several reasons. First, glaciers act as vast freshwater reservoirs, prompting research into the timing and quantity of runoff that will occur as they continue to lose volume in warming temperatures. Also, a catchment’s concentration of dissolved minerals, organic compounds, and pollutants changes as meltwater patterns change, impacting water quality for downstream ecosystems as well as for human consumption and irrigation.
Finally, from an outreach perspective, the rapid disappearance of glaciers has sparked interest in the broader community affording scientists, resource managers, and interpreters the opportunity to use data to engage in an active dialogue with the public about climate and environmental change.
Related Research
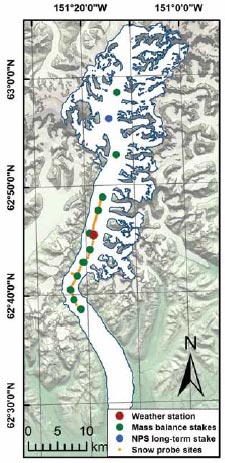
The National Park Service (NPS) initiated a measure-ment program on the Kahiltna Glacier in 1991, working with Lawrence Mayo (U.S. Geological Survey) and Dr. Keith Echelmeyer (University of Alaska Fairbanks). These researchers established a single long-term monitoring site, where NPS glaciologists continue to make biannual measurements (Figure 2).
Park scientists also recently collaborated with University of Alaska Fairbanks glaciologists to examine glacier area change within DNPP, where they observed an overall pattern of glacier retreat (Burrows et al. 2011). Our work leverages and expands on these studies, quantifying glacier-wide mass losses and examining multiple time periods.
Other studies have also provided information about the flow dynamics of the Kahiltna Glacier. Researchers at Alaska Pacific University have worked to constrain the timing of re-emergence of human waste deposited along the well-traveled West Buttress climbing route on Mount McKinley, and to evaluate potential effects on downstream water quality (Goodwin et al. 2012).
Near-surface radar has recently revealed different thermal zones in the glacier, providing information that can help constrain future mass change projections (Gusmeroli et al. 2013). Ground-penetrating radar studies have also been conducted, with the goal of locating an ice core site for reconstructing climate trends during the last few centuries (Campbell et al. 2012).
Collaborations with these research groups have been helpful for sharing data and logistics, and for broadly exploring the changing face of the Kahiltna Glacier.
Methods for Estimating Mass Balance
Glaciers are defined by two main characteristics.
First, they are composed of snow that persists for longer than one year. As the snow accumulates year after year, it compresses under overlying snow to eventually form glacier ice. This accumulation process is the primary means by which mass is added to a glacier. Second, glaciers flow downhill, giving rise to the description of glaciers as “rivers of ice.” As it is transported from high mountains to lower elevations, the ice encounters warmer air temperatures and experiences summer melt.
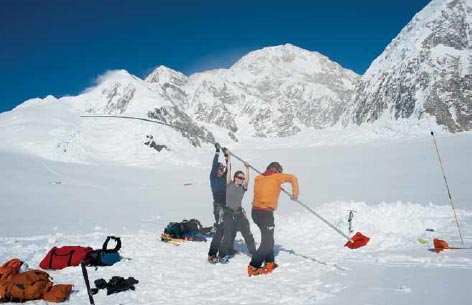
This surface melting—or ablation—is the main process by which a land-terminating glacier like the Kahiltna loses mass. Altogether, a glacier’s mass change or mass balance is defined as the difference between annual accumulation and ablation. Traditionally, glaciologists have measured mass change through simple methods. Mass balance stakes are installed vertically into the ice at the beginning of summer and visited later to measure surface lowering (Figure 3).
Accumulation is measured by digging snow pits and sampling snow density, yielding the total water content of the snowpack. This is the method used by NPS glaciologists on the Kahiltna Glacier. The four methods below describe how scientists use melt models, airborne data, and satellite technologies to estimate mass changes for the entire glacier.
1. Melt Modeling
Melt modeling is a computational approach that relies on field observations of air temperature for input, and accumulation and ablation at mass balance stakes for calibration. Several field campaigns were carried out on the Kahiltna Glacier in 2010 and 2011.
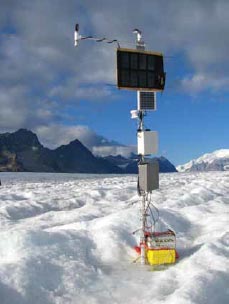
We installed 11 stakes and five temperature sensors at different elevations, and two weather stations to monitor local conditions (Figure 4). The winter snowpack was characterized by snow depth and density measurements, supplemented with data from nearby weather stations.
We then use a melt model (Hock 1999) to derive a relationship between air temperature and melt. The model determines mass balance at every point on the glacier, based on elevation gradients of air temperature, melt, and snowfall. We use our 2010 and 2011 ground measurements for input and calibration, and apply the model retroactively for 20 years using a past climate data product and the NPS mass balance record.
We calculate an average balance of -5.97 +/- 3.77 feet water equivalent per year (ft we/yr) (-1.82 +/- 1.15 m we/yr) for the period 1992-2011 (Figure 5).
2. DEM Differencing
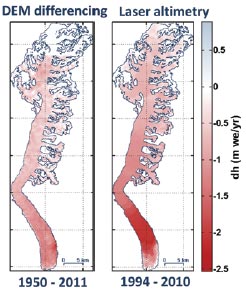
In this method, multiple digital elevation models (i.e. DEMs, or maps of elevations at every point on the glacier) from different time periods are compared to determine how the glacier surface has evolved. For the Kahiltna Glacier, we start with a DEM derived from U.S. Geologi-cal Survey maps based on aerial photographs from about 1950, and compare this to a 2011 DEM based on airborne radar observations (http://www.gina.alaska.edu/).
The resulting difference map shows the glacier surface changes that occurred between the early 1950s and 2011 (Figure 5). The map reveals thinning over 92% of the area for which data is available (note: the northernmost region has limited satellite imagery). Averaged over the full glacier, we obtain an annual mass change of -1.51 +/- 0.46 ft we/yr (-0.46 +/- 0.14 m we/yr).
The 1950s DEM was generated using aerial photographs, and the 2011 DEM was based on airborne radar observations (note: the upper region lacks data due to limited satellite imagery). Map units are in meters of water equivalent per year.
3. Laser Altimetry
Glacier surface height changes can also be measured via repeat airborne laser altimetry, a technique carried out by University of Alaska Fairbanks glaciologists since 1993 (Johnson et al. 2013).
Mounted in a small airplane, the system is composed of a high-accuracy Global Positioning System (GPS) receiver, a laser rangefinder, and a gyroscope. The GPS records the position of the plane as it flies down a glacier centerline, the laser continuously measures the distance between the plane and the ice surface, and the gyroscope measures the laser’s pointing direction.
From these, centerline surface elevation profiles are created. Repeating the flights every few years allows scientists to compare profiles over time, and to extrapolate the changes to the entire glacier.
Figure 6 (see 1994-2010 graphic) shows surface height differences determined between 1994 and 2010. We find significant thinning at all elevations measured (note: the highest elevations were not sampled). Averaged over the entire surface, the annual balance is -2.46 +/- 0.33 ft we/yr (-0.75 +/- 0.10 m we/yr).
Estimates have also been generated for different time periods: from the 1950s to 1994, by comparison to the 1950s DEM described earlier, we find -1.51 +/- 0.36 ft we/yr (-0.46 +/- 0.11 m we/yr), and for 2008-2010, we find -3.25 +/- 1.51 ft we/yr (-0.99 +/- 0.46 m we/yr).
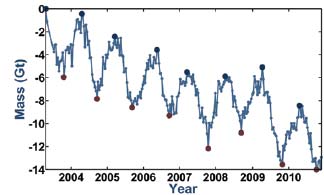
Fig 7 -- Mass change in gigatons (Gt) is expressed relative to the first date of observations. End-of-winter maxima, after snow accumulation, are indicated in dark blue; end-of-summer minima, after summer melt, are shown in red. The annual mass balance for the region is taken as the difference between sub-sequent minima, and this value is then scaled to the Kahiltna Glacier alone.
4. GRACE Gravimetry
Glacier mass balance can also be estimated using data from the National Aeronautics and Space Administration (NASA) Gravity Recovery and Climate Experiment (GRACE). These twin satellites orbit one behind the other, equipped with a high-precision ranging system that detects miniscule changes in the distance between them.
As the first satellite passes over a denser land mass, it is pulled slightly ahead. Scientists use these changes in distance to construct monthly maps of the Earth’s gravity field, which are then separated into groundwater movement, atmospheric changes, and glacier mass changes. Zooming into one ice-covered region, like DNPP, scientists can construct a time series of mass changes that have occurred therein (Figure 7).
Scaling these results to the Kahiltna Glacier, we calculate an average mass balance between 2003-2010 of -1.18 +/- 0.36 feet we/yr (-0.36 +/-0.11 m we/yr ).
Discussion
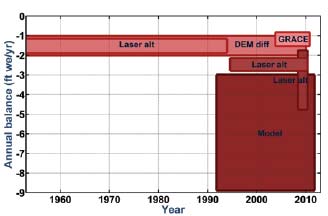
Mass losses are revealed by each of four techniques for every observation period from the 1950s to today. (Figure 8). We see strong agreement between early laser altimetry estimates and DEM differencing. We also see evidence for melt acceleration towards the late 1990s/early 2000s, agreeing with other findings as it occurred concurrently with a 1.4F (0.8oC) increase in average summer temperatures recorded near DNPP (Arendt et al. 2009).
We find, however, that the preliminary melt model estimate seems to overestimate mass losses and has greater error than the other techniques. This is likely due to the sparse ground data available, and attests to the challenges of obtaining sufficient field measurements for a large, remote glacier.
Further analyses may help refine this estimate and associated error. Ultimately, our study confirms the importance of comparing multiple techniques to constrain mass changes, and points to airborne- and satellite-based methods for obtaining data for previously inaccessible glacier regions.
Conclusions
Our study finds that the Kahiltna Glacier, the largest river of ice in Denali National Park and Preserve, is losing mass and becoming thinner. Scientists agree that the mass losses seen in glaciers of Alaska and the world are a result of increasing air temperatures over the past several decades.
These losses are, at the local scale, affecting downstream freshwater supply; at the broader scale, they contribute to sea level rise. Despite being fed by significant snowfall from the highest peak in North America, the Kahiltna Glacier has been losing mass in warming temperatures, leading to gradual but visible changes in the Denali National Park landscape.
Acknowledgments
The authors acknowledge Dr. Regine Hock for melt modeling guidance, Dr. Chris Larsen, Dr. Nathaniel Murphy and Lee Zirnheld for laser altimetry estimates, and Sam Herreid for contributions to figures, all of the University of Alaska, Fairbanks. We also thank Rob Burrows and Guy Adema (National Park Service) for field assistance and Dr. Michael Loso (Alaska Pacific University) for ongoing collaboration. Funding was provided by the George Melendez Wright Climate Change Fellowship, the Center for Global Change, the Cooperative Institute for Alaska Research, the North Pacific Research Board, and NASA’s Cryospheric Sciences program (grant NNH07ZDA001N-CRYO).
Part of a series of articles titled Alaska Park Science - Volume 12 Issue 2: Climate Change in Alaska's National Parks.
Last updated: February 2, 2025
