Status and trends of Alaska national park glaciers: what do they tell us about climate change?
Introduction
NPS Photo
Most visitors to Alaska’s National Parks are by now familiar with the fact that the state’s many glaciers are changing. Many glaciers are shrinking, and “retreat” of the glacier terminus is usually the most obvious manifestation of that change.
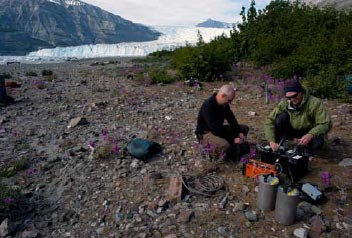
But while some glaciers (like the Yahtse Glacier in Wrangell-St. Elias National Park and Preserve, Figure 2) have experienced dramatic retreat over the last century or so, others appear surprisingly stable. And a handful of glaciers are actually advancing. Given this complexity, and the importance of glacier changes for issues ranging from road maintenance to global sea level, it may surprise many visitors to find out that until recently, NPS lacked the most basic tool for understanding these changes: a comprehensive inventory of the glaciers in its parks.
Prior to the work we describe here, many of Alaska’s glaciers had not been remapped since the US Geological Survey made its original topographic maps in the 1950s and 1960s—maps that modern backcountry travelers still use, but have learned to view with some skepticism when navigating through glaciated terrain.
Figure 2 provides a striking example: according to the USGS topographic map for western Icy Bay, the scientists on that rocky beach should be under at least 175 meters of ice. That map, based on 1957 aerial photography but still available to the public, shows the Yahtse Glacier terminus over 5 miles (8 km) downstream of its position in this 2011 photo.
The outdated glacier boundaries and surface elevations from old maps have challenged scientists, too: lacking even the most basic information on the current extent of glaciers, Alaskan geologists and ecologists had no basis for inferring trends over time or the relationship of these trends to climatic changes.
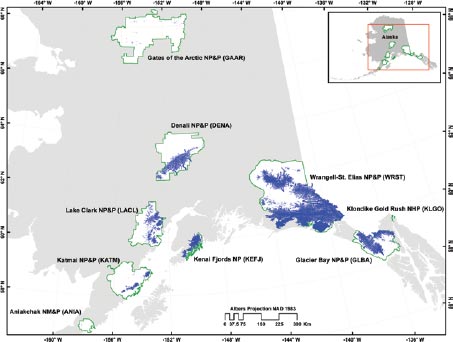
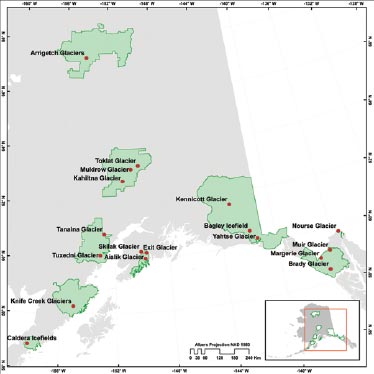
Modern tools like satellite imagery, laser altimetry, and high-accuracy differential GPS have enabled some academic and NPS researchers to accurately map modern glacier extents within the limited scope of individual research projects, but this work was initiated to address the outstanding need to comprehensively and consistently document glacier extent throughout the glaciated national park lands in Alaska (Figure 3).
Our project, which began in 2010 and is scheduled for completion in December 2013, relies primarily on existing data to assess glacier status and trends in three ways: 1) map glacier extents for all glaciers, 2) assess changes in glacier volume for a smaller subset of glaciers, and 3) write interpretive summaries of glacier change for 1-3 “focus glaciers” per park. The scope of the project is further summarized in Table 1; here, we present some preliminary results and discuss their implications.
A New Map of Glacier Extents
NPS Image
There is one obvious reason why all the glaciers in Alaska’s parks had not been remapped since the mid-20th century. There are a lot of them. The precise number was until recently not even known, but our new map (Figure 3) includes 7012 distinct modern glaciers that are contained wholly or at least partly within the boundaries of nine Alaskan National Park units (Table 2). Those glaciers cover about 16873 mi2 (43,700 km2) of land, about half of the approximately 33938 mi2 (87,900 km2) of total ice coverage (including glaciers outside of the National Parks) in Alaska and neighboring Canada (Berthier et al. 2010).
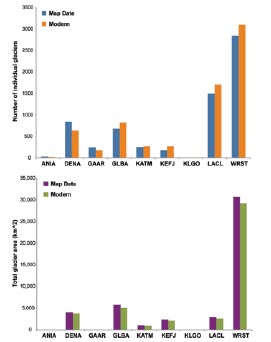
As a glance at Figure 3 makes clear, the glaciers are not evenly distributed among the parks. The glacier heavyweight, by far, is Wrangell-St. Elias NPP. Nearly half of the Alaska Park glaciers are in WRST (Figure 4), but the ice coverage there is even more important when measured by total ice coverage: WRST accounts for 67% of all ice-covered area in the Alaska parks.
Generally, Glacier Bay, Denali, and Lake Clark are the next most important parks in terms of glacier coverage, Katmai and Kenai Fjords contribute slightly less, and glaciers of Klondike Gold Rush, Aniakchak, and Gates of the Arctic are relatively minor, though what Gates of the Arctic lacks in glacier area it makes up for partially in glacier number: the park actually has 178 glaciers—they’re just all small.
The numbers just presented are based entirely on analysis of “modern” (2003-2010) satellite imagery (mostly Ikonos and Landsat). We often started with preliminary outlines from other sources, but then laboriously edited them manually, one mouse click at a time, on a computer screen. Accuracy of the process thus depends not only on judgment, but also on the resolution, cloud cover, time of year, and even time of day for a given image. But over time, satellites take many images, allowing us to select only the best ones to work from.
Cartographers that created the USGS topographic maps upon which our “map date” inventory was based (Table 2 and Figure 4) had no such luxury, and were typically forced to judge glacier boundaries and elevations from a single aerial photo.
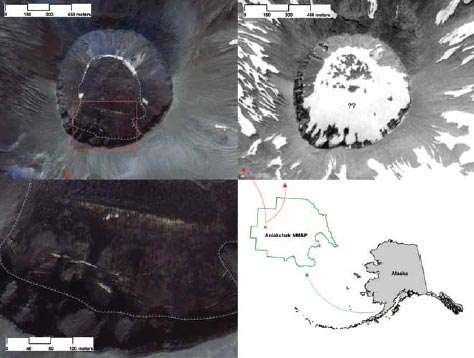
An example from Aniakchak NM&P exemplifies the challenge of comparing historic and modern datasets (Figure 5). High-quality satellite imagery clearly depicts crevassed glacier ice, a conclusion corroborated by Alaska Volcano Observatory scientists who have worked inside the caldera rim (Neal et al. 2001 and Figure 6).
But was that ice present in 1957, when aerial photos used to make the topographic map were taken? Examining the comparatively low-resolution aerial photo taken early enough in the melt season to contain substantial remnant seasonal snowcover, the USGS cartographer reasonably enough decided no. But because the debris-mantled glacier ice seen in the caldera today could not conceivably have formed in just a few decades, we conclude that the original map (and hence, the “map date” portion of our inventory, which is an unedited digital archive of glaciers on the original USGS maps) is wrong.
The trend of increasing glacier numbers (Figure 4) may partly reflect the real subdivision of shrinking valley glaciers into multiple smaller tributaries, but we judge that trend mostly to phenomenon described above. The 7% decline in statewide glacier-covered area is probably a more robust reflection of real changes in the half-decade since most of the USGS maps were made (Figure 4).
It is, in fact, a conservative estimate, since the modern figure includes the areas of many small glaciers that were mapped for the first time in satellite imagery. Loss of glacier cover is also a consistent trend, occurring to some extent or another in every park but Aniakchak, where the newly mapped caldera ice dominates the very small signal.
Zooming in on the Map
NPS Image
At the broad, statewide scale, there is a clear scientific consensus that warming temperatures are the primary factor driving the loss of glacier ice. But every glacier is different, and behind this generalization are many complications. We are using the focus glacier component of this project (Figure 7) to tell the stories of some of the diverse ways that glaciers respond not only to climate, but also to the landscape around them.
Our focus glaciers include, for example, several tidewater or recently-tidewater glaciers with highly variable trends in extent. Yahtse Glacier is one. It was discussed earlier for its dramatic retreat since 1957, but it has recently been advancing.
Meanwhile, the terminus of Brady Glacier has been remarkably stable for the last several decades while slowly building an outwash plain (Figure 1). The fluctuations of these and other Alaskan tidewater glaciers represent different stages of the well-known tidewater glacier cycle—a process that is only indirectly tied to climate (Post et al. 2006).
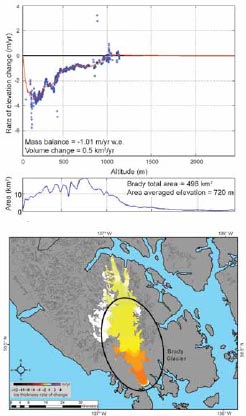
Brady Glacier also highlights the importance of considering glacier thickness (and not just extent) when looking at glacier change over time. The Brady’s stable terminus hides an ongoing and substantial “deflation” of the glacier surface that repeat laser altimetry measurements reveal. Measurements from 1995-2000 document an average annual loss of 0.12 mi3 (0.5 km3) ice volume (Figure 8).
Similar results from 2000 to 2010 are not shown. Our final report will include comparable analyses for over 60 glaciers distributed through five of the Alaskan parks.
The Knife Creek Glacier, in Katmai NP&P, is a focus glacier that illustrates another interesting wrinkle: many of the glaciers in our study lie on or downwind of Alaska’s abundant volcanoes. On June 6 and 8, 1912, the world’s largest volcanic eruption of the 20th century blanketed this glacier, and the surrounding landscape, in a thick layer of volcanic ash. Subsequent caldera collapse then added insult to injury, “beheading” the glacier by removing a substantial portion of its accumulation zone.
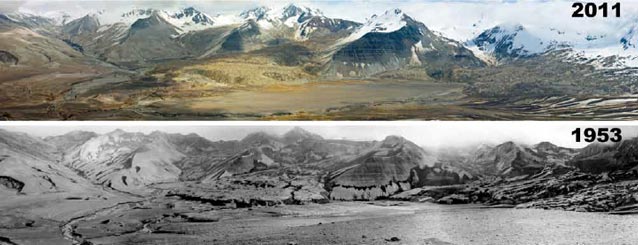
With repeat photography (Figure 9) and other analyses we concur with earlier researchers (Muller and Coulter 1957) who concluded that the competing effects of these two phenomena—ash deposition reducing melt rates after removal of the glacier’s upper elevations reduced accumulation—have combined to yield surprisingly little change in the overall size of this embattled glacier.
Other focus glaciers will provide us an opportunity to consider the unique qualities of surging glaciers, small debris-covered cirque glaciers, a massive icefield, ice and moraine-dammed lakes, and a massive icefield (Figure 7).
Our goal is neither to be comprehensive nor representative, but rather to highlight the diversity of glacier types and behaviors, and to consider anecdotally the consequences of these behaviors for the ecology, hydrology, geomorphology, and human geography of the landscapes they inhabit.
NPS Images
Figure 5, at right: A comparison of base imagery used for mapping glacier outlines in Aniakchak Caldera, in Aniakchak NM&P. The USGS topographic map for this region was based on a 1957 aerial photo shown at upper right. The cartographer saw (and mapped) no glaciers. The modern Ikonos satellite image at upper left, and shown in greater detail at lower left, clearly reveals crevasses that help distinguish a debris-covered glacier surface outlined in blue.
| Extent Mapping | Volume Change | Focus Glaciers | |
|---|---|---|---|
| Project Objectives | Map modern (2003-2010) and historic (typically 1950s and 1960s) outlines of glaciers | Determine glacier surface elevation changes over recent decades with repeat laser altimetry | Summarize known history of glacier change and landscape response over all known timescales |
| Scope of Effort | All glaciers in all units, including some park-adjacent glaciers Map modern (2003-2010) and historic (typically 1950s and 1960s) outlines of glaciers | Existing coverage only: zero to1 - 3 glaciers per park | |
| Data Sources | Modern glaciers: satellite imagery Historic glaciers: USGS topographic maps | Aircraft-mounted laser point data flown at quasi-decadal intervals on select glaciers | All available sources of data, ranging from historic photographs to modern research analyses |
| Key Personnel | Arendt and Rich (UAF) | Larsen and Murphy (UAF) | Loso (APU) |
NPS Image
Conclusions
NPS Image
With respect to climate change, glaciers have been called “the canary in the coal mine.” The implication—that by watching the glaciers we can more easily infer the more subtle changes occurring in our climate system—depends on somebody actually watching the canary. In our case, that means a regular, systematic, and comprehensive program of glacier monitoring. With this project, NPS has taken a major step towards accomplishing that goal.
The final results of our work will be presented in two products. A Natural Resource Technical Report will document data sources, methodology, and results; analyze those results; and discuss the implications of those analyses. It will be accompanied by a permanent electronic archive of geographic and statistical data and is intended to serve a specialized audience interested in working directly with the project’s datasets.
An interpretive report will be a non-technical document suitable for glaciologists, park interpretation specialists, park managers, and park visitors with no particular background in science or glaciology. The document will be comprehensive and thorough, however, and is envisioned as graphics and photo-intensive, content rich, and accessibly written. Content will include a comprehensive literature review, detailed summaries of the key findings of the technical report, and the focus glaciers narratives.
NPS Images
Figure 9. Repeat photographs of the Knife Creek Glacier showing it on 15 June 2011 (above) and 6 July 1953 (below). Photos taken from approximately 3700’ (1,100m) on the eastern summit of Broken Mountain, Valley of Ten Thousand Smokes. Snow appears black in the older image. Photos: JT Thomas (upper) and E.H. Muller (lower).
Part of a series of articles titled Alaska Park Science - Volume 12 Issue 2: Climate Change in Alaska's National Parks.
Last updated: October 23, 2021
