NPS/Aaron Wells
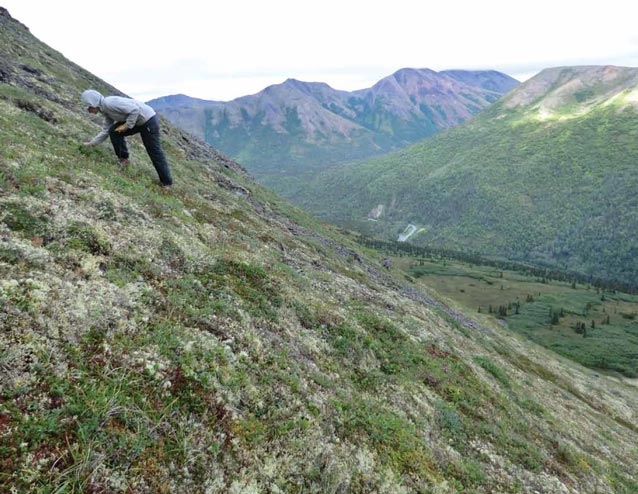
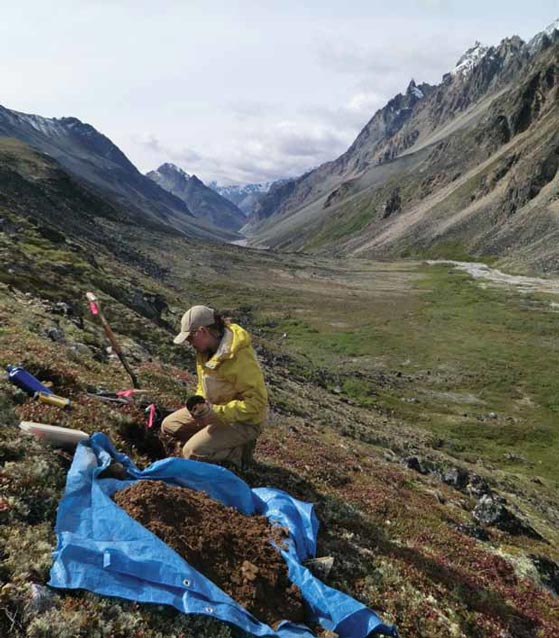
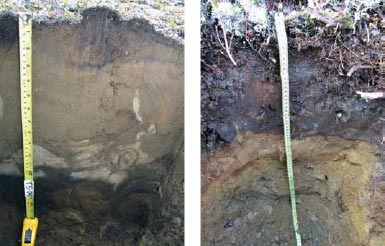
Figure 1. (A) Field surveys teams were comprised of a botanist and soil scientist. They collected data on vegetation species composition and structure, soil physical and chemi-cal characteristics, soil stratigraphy, geomorphology, and hydrology. Each plot required approximately one hour for completion and each team completed 5 to 10 plots per day. (Figure 1. B)
Introduction
NPS/Aaron Wells
The jagged peaks, massive ice caps and glaciers, steaming volcanoes, broad glacial valleys, brilliant turquoise lakes, expansive spruce forests, emerald tidal meadows, and sinuous glacial rivers of Lake Clark National Park and Preserve (Lake Clark NPP) form an awe-inspiring landscape and lend to a diverse array of climate patterns, geologic features, soils, and ecosystems. Located in the northern Alaska Peninsula, Lake Clark NPP is situated where the Alaska Range meets the Aleutian Range. At 6.7 million acres (27,000 sq. km) it is the seventh largest park in the National Park Service (NPS) system.
To establish baseline information and to provide information on long-term trends in the conditions of these natural resources, the NPS has developed inventory and monitoring programs for vegetation, terrestrial wildlife, fish, weather, and coastal and glacial processes. These programs help the NPS to detect changes in ecosystem and determine how human activities (e.g., invasive species, land disturbances) or large-scale phenomena (fire, climate change, earthquakes) have played a part in observed changes. The inventory and monitoring programs also help the NPS focus their efforts to manage and protect park resources for the future. Soils provide fundamental controls on landscape and vegetation dynamics by greatly influencing plant community composition, successional processes, foodweb dynamics, and a host of other ecosystem functions, and are therefore a key component of the NPS Inventory Program. In support of these objectives, ABR, Inc.-Environmental Research & Services worked with the NPS to 1) design and implement an ecological land survey (ELS) to map the ecosystems and soils in Lake Clark NPP, and 2) initiate a near infrared soil spectroscopy study for parks in southwestern Alaska.
An ELS land classification, in conjunction with a landcover map, enables resource managers to more effectively evaluate land resources and develop appropriate management strategies. An ELS is an integrated approach of inventorying and classifying ecological characteristics while using environmental and GIS modeling to better differentiate the distribution of ecosystems across space. An ELS can be used to efficiently allocate inventory and monitoring efforts, to partition information for analysis of ecological relationships, to develop predictive models, and to improve techniques for assessing and mitigating impacts.
Near infrared (NIR) spectroscopy has been used across multiple disciplines to assess a variety of materials, including soils. In NIR spectroscopy, the spectral signature of a material is defined by the ratio of the amount of energy reflected to the amount of energy absorbed by a substance, as a function of wavelength in the electromagnetic spectrum (Shepherd and Walsh 2002). Recent research has demonstrated the ability of NIR spectroscopy to provide rapid and inexpensive prediction of soil chemical and physical properties (Awiti et al. 2008). Samples from 18 different soils from Lake Clark NPP were sampled for spectral, chemical, and physical analyses to be used 1) in a pilot study designed to assess the feasibility of using NIR data for predicting soil chemical and physical properties and linking those properties to soil taxonomy, and 2) in the future with additional soil samples to develop an NIR spectrographic library for soils from the parks in southwestern Alaska.
NPS/Aaron Wells
Methods
NPS/Aaron Wells
Ecological Land Classification and Soil Landscape Mapping
To implement the ecological land classification portion of the overall effort, we used a simplified integrated terrain unit approach similar to Jorgenson et al. (2009). The initial steps involved the analysis of field data to identify hierarchical landscape-ecological relationships, including 1) conducting an integrated ELS to characterize vegetation, soils, and other ecological characteristics, 2) classifying and coding individual ecological components (physiography, geomorphic unit, vegetation structure) using standard classification systems developed for Alaska, 3) laboratory analysis of a subset of soil samples to characterize soil chemical and physical properties, and 4) classification of plant communities and soils (Soil Survey Staff 2010). Multivariate analyses were used to identify landscape-ecological relationships between ecological components and classify ecotypes that integrate co-varying ecological properties.
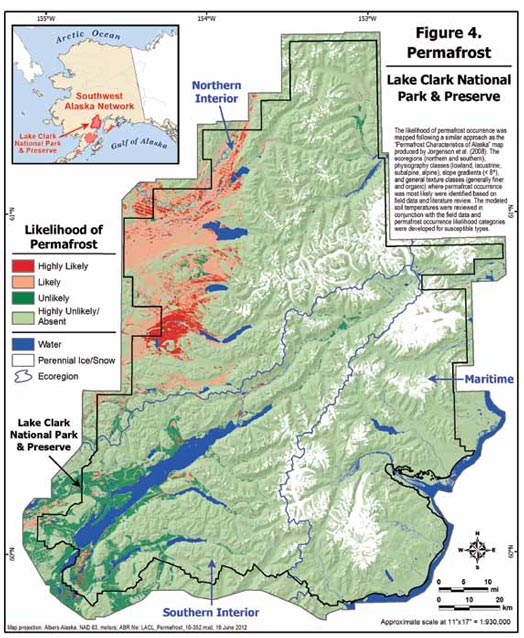
The landscape-ecological relationships identified in steps 1-3 above were then applied in a Geographic Information System (GIS) model to map ecosystems and soils across Lake Clark NPP. Remote sensing and GIS data were compiled for a range of ecological components, including land cover (vegetation), elevation, ecological subsections, coastal habitats, hydrography, topography, climate, surficial and bedrock geology, wetlands, snow regime, and glaciers. These data layers were analyzed and processed spatially to characterize the major components that partition the landscape and soils. In addition, the data were used to develop a set of base maps for ecotype and soil modeling, including ecoregion, physiography, generalized soil texture, soil temperature, permafrost (Figure 4), and vegetation. The above map layers were overlaid in a GIS to create a combined layer in which unique combinations of landscape elements were considered “strata.” The strata were then aggregated into ecotypes using the landscape-ecological relationships and soil analytical results identified in the above analysis. This aggregation served as the basis for mapping the distribution of ecotypes and soil landscapes across Lake Clark NPP.
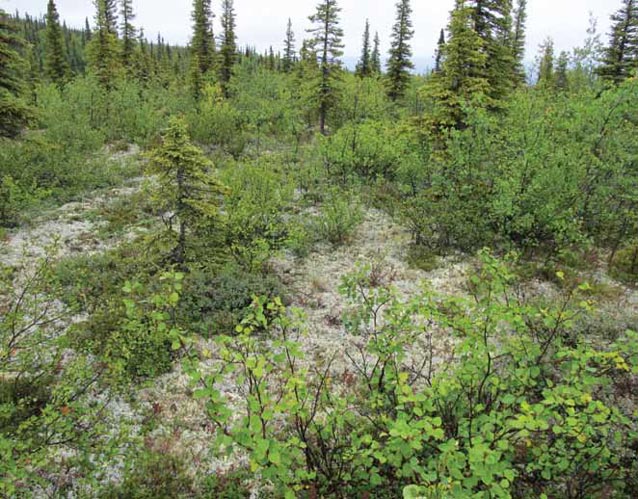
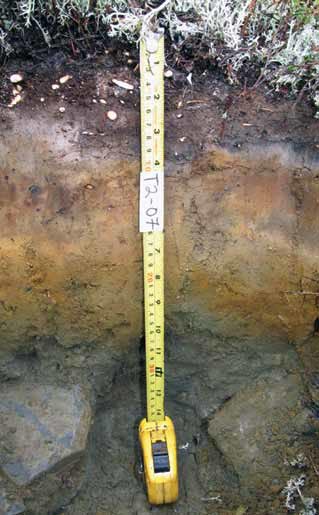
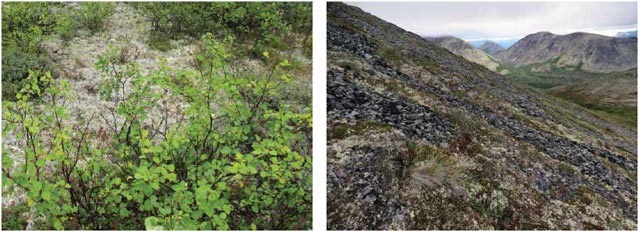
We conducted field work over two sampling periods in 2011. Transect locations were stratified across the landscape using a gradient-directed sampling scheme (Austin and Heyligers 1989) to sample the range of ecological conditions and to provide the spatially-related data needed to interpret ecosystem development. Intensive sampling was conducted along the transects, and data collected at 266 plots along 44 transects. Along each transect, five to ten plots were sampled, each in a distinct vegetation type or spectral signature identifiable on satellite imagery. At each plot (~33 ft, or 10 m radius), descriptions or measurements were made of GPS location, geology, surface form (micro- and macro-topography), hydrology, soil stratigraphy, and vegetation cover and structure (Figures 1-3). Soil samples were collected at a subset of sites for use in NIR analysis.
Soils Near Infrared Library
Soil samples collected from 18 plots were air-dried and sieved through a 2mm sieve and sent for spectral analysis (350-2,500 nm range) to the VisNIR Diffuse Reflectance Spectroscopy Service Center (Washington State University). Samples were also sent for select chemical and physical analyses, including: total carbon and nitrogen; organic carbon; percent phosphate retention; percent sand, silt, clay (University of Alaska Palmer Research Center); and percent volcanic glass (Alaska Beget Consulting). Multivariate statistical analyses were used to identify soil spectral groups based on similar absorbance spectra. Physical and chemical laboratory data were then summarized by soil spectral groups.
Results and Discussion
NPS/Aaron Wells
We identified 71 plant associations using multivariate classification techniques. Soils from eight soil orders and 95 soil subgroups of soil taxonomy (Soil Survey Staff 2010) were encountered during field sampling (Figure 5). Soil orders included Alfisols, Andisols, Entisols, Gelisols, Histosols, Inceptisols, Mollisols, and Spodosols. We classified 93 ecotypes that best categorize the variation in ecological characteristics across a broad range of aquatic and terrestrial environments (Figure 6). The 93 ecotypes were combined for mapping purposes into a reduced set of 55 ecotype classes (termed map ecotypes). The strata layer was then re-classified to develop a map of ecotypes in Lake Clark NPP (not shown).
Soil-landscape associations, or soil landscapes, were developed to characterize and map broader relationships among soil type, physiography, and vegetation. The most common soil landscape classes included alpine rocky barrens and shrublands (16%); alpine gelic rocky barrens and shrublands (16%); glaciers and permanent snow fields (11%); interior subalpine rocky barrens, shrublands, and forests (7%); and interior subalpine ashy-rocky-organic forests and shrublands (7%). The strata layer was then reclassified to develop a map of soil landscapes (Figure 7).
Multivariate analysis of soil NIR spectra identified three groups of soils with similar absorbance spectra (Figure 8). Soils in Group 1 had the lowest average percent organic carbon, volcanic glass, silt, and phosphate retention, and the highest average percent sand (Figure 9). Soils in this group corresponded to volcanic ash-poor Spodosols, Alfisols, Mollisols, and Inceptisols. Soils in Group 2 had the highest average percent organic carbon and phosphate retention, and moderate percent sand and volcanic glass. Soils in this cluster corresponded to older, well-developed Andisols and andic (volcanic ash-rich) subgroups of Inceptisols and Spodosols. Soils in Group 3 had low average percent organic carbon and moderate percent sand, high average percent phosphate retention, and the highest average volcanic glass content. They corresponded to younger, poorly developed Andisols and ash-rich Entisols. Multivariate analysis of the NIR spectra grouped soils with similar physical and chemical properties, which corresponded well with soil classifications. For instance, older, well-developed Andisols and other volcanic ashsoils (Group 2) tend to have large accumulations of soil organic carbon and extremely high phosphorus retention capacity (Ugolini and Dahlgren 2002). These older soils are more weathered, and a larger proportion of volcanic glass is broken down into constituent elements. Younger Andisols and Entisols (Group 3) with recent volcanic ash deposition have lower accumulations of organic carbon, and the highest volcanic glass content, as insufficient time has passed for weathering and transformation.
Conclusions
NPS/Ron Karpilo
The ecological land survey approach to understanding landscape processes and their influence on ecosystem functions provides two main benefits. First, landscapes are analyzed as ecological systems with functionally related parts, recognizing the importance of geomorphic and hydrologic processes to disturbance regimes, the flow of energy and material, and ecosystem development. This hierarchical approach, which incorporates numerous ecological components into ecotypes with co-varying properties, allows users to partition the variability of a wide range of ecological characteristics. The ELS approach when combined with GIS modeling and the landscape relationships developed from ecotype analysis, allowed for the development of an enhanced set of ecosystem types from existing landcover mapping that essentially differentiates ecosystems at the site level of ecological land classification. For instance, superimposing a delineation of areas that are influenced by tidal waters and storm surges (i.e., coastal physiography) over the existing landcover map allowed for the delineation of coastal salt marshes in Lake Clark NPP where they were not mapped in the stand-alone landcover map. Secondly, the linkage of landcover maps to climatic, physiographic, and topographic variables improves our ability to predict the response of ecosystems to human impacts and facilitates the production of thematic maps for resource management applications and analyses.
The results of the NIR soil spectroscopy pilot study suggests that this technique may be effective at predicting soil chemical and physical properties and linking those properties to soil taxonomy. However, the full benefits of soil NIR spectroscopy will be realized through the development of a soil NIR spectral library (Shepherd and Walsh 2002), of which this study component represents the early stages. We foresee two potential applications for a spectral library. First, the spectra could be linked to landscape-scale variables in a GIS to develop maps of soil spectral properties in the study area, similar to Viscarra Rossel and Chen (2011). Secondly, the spectral library could serve as a baseline for assessing and monitoring soil conditions in southwestern Alaska parks into the future. For instance, NIR spectroscopy has been used as a rapid, inexpensive method for measuring soil carbon (McCarty et al. 2002) and NIR soil spectral properties have recently been mapped at broad spatial scales. Hence, the potential exists for the soil spectral library to serve as a baseline for mapping and monitoring soil carbon at the landscape scale.
Part of a series of articles titled Alaska Park Science - Volume 12 Issue 1: Science, History, and Alaska's Changing Landscapes.
Last updated: August 10, 2016
