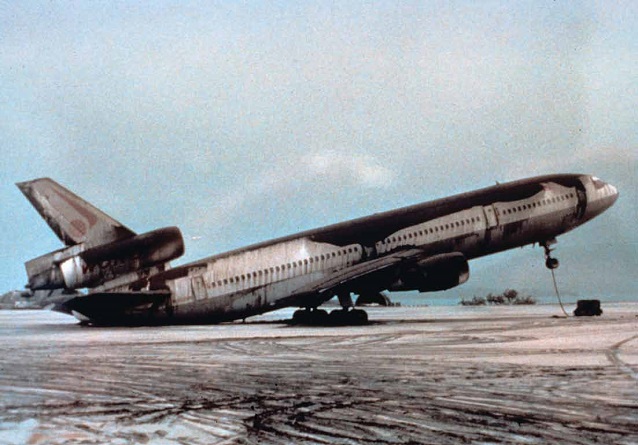
US Navy photograph by R.L. Rieger. June 17, 1991. T.J. Casadevall 15
Introduction
One hundred years ago the Novarupta Volcano erupted, sending ash over the globe, and was the biggest eruption of the twentieth century. The ash settled over the U.S.A., Canada and as far as Africa (Fierstein 2007). Today, the North Pacific is one of the busiest air corridors in the world (Kite-Powell 2000). The eruption of Eyjafjallajökull in April 2010 demonstrated how disruptive a volcanic eruption can be to the aviation industry, as Europe was almost brought to a standstill (Chung and Pearce 2010). Al Jazeera (2010) reported that by the third day of the eruption, 17,000 flights had been cancelled across Europe.
Europe has extensive infrastructure; not all countries are so lucky, and must rely on air travel. The relatively small eruption in Iceland raised questions about the possible effects of a larger eruption, particularly in an area where air traffic is vital, such as Alaska and northern Canada. With the Iceland eruption in mind, this project investigated the possible effects on eruption of a Novarupta-scale eruption. Its size and location below a busy air corridor made it ideal for the study.
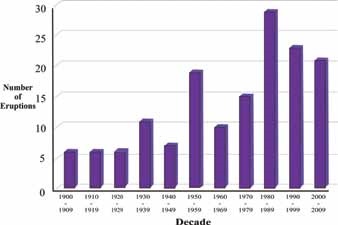
Alaskan Volcano Observatory
Novarupta
Alaska has over 100 active volcanoes (Dean et al. 2002, Topinka 1999), and there have been at least five eruptions in Alaska per decade since 1900, with the last three decades being exceptionally active (AVO, accessed 2010) (Figure 2). Novarupta is one of nine volcanic vents in the Katmai cluster (Fierstein and Hildreth 2001), and the Katmai cluster has had 15 eruptive episodes in the last 10,000 years (Fierstein and Hildreth 2001, Fierstein 2007). The area is prone to most volcanic hazards (i.e. ash clouds, pyroclastic flows, lahars etc.) (Fierstein and Hildreth 2001). Although the Katmai cluster is isolated from towns and cities, it is vital that scientists, decision makers and residents understand the potential threats the cluster could pose to Alaska, America and the rest of the world.
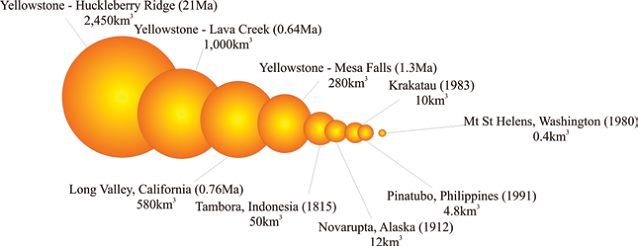
Adapted from Fierstein et al. 1998
The 1912 Eruption
The Novarupta eruption started on June 6, 1912, and lasted approximately 60 hours (Fierstein and Hildreth 2001). The ash cloud rose to over 100,000 ft (32,000 m) (Fierstein and Hildreth 2001), and the jet stream carried the ash eastwards. The size of the 1912 eruption is compared to others in Figure 3.
The eruption formed the Valley of 10,000 Smokes. It created and spread more ash fallout than all the other historic eruptions from Alaska volcanoes combined (Fierstein and Hildreth 2001, Fierstein 2007). The dust and sulphurous aerosols were detected over California, Europe and North Africa within two weeks of the eruption (AVO, Fierstein and Hildreth 2001). It was also reported that an ash blanket reached as far as Greece (Fierstein and Hildreth 2001). The ash and dust deposited has shown up in ice cores taken from Greenland (Fierstein and Hildreth 2001). Other recorded effects were extensive and included collapsed roofs, contaminated water supplies, a devastated fishing industry and cooler summers (AVO, Fierstein and Hildreth 2001, NPS 2000).

Who Is At Risk?
Fierstein and Hildreth (2001) believe there to be 5 main aspects of Alaskan communities that are most at risk from Katmai cluster eruptions: 1) Alaska’s air corridor; 2) Regional and military bases and ports; 3) Fisheries and shipping lanes; 4) Wildlife habitats; and 5) Tourist facilities. Whilst each of these aspects is closely connected, we will focus on the first one.
Today over 200 flights per day pass in the range of Alaska’s volcanoes (Fierstein and Hildreth 2001, Kite-Powell 2000). Air freight is the primary source of aviation commerce in Alaska, and many of the smaller communities rely on local airports for supplies (Dean et al. 2002). About $41 billion (5%) of all US-international air cargo passed through Ted Stevens Anchorage International Airport in 2008 (BTS 2009). Air traffic over the entire North Pacific, Alaska, Canada and U.S.A could be affected, interrupting both national and international air commerce (Fierstein and Hildreth 2001).
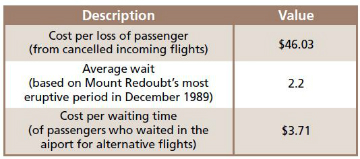
Tuck et al. 1992
Methodology
Simulations were run on the Puff model (created by the Alaskan Volcano Observatory and the University of Alaska Fairbanks). The parameters used for the simulations can be seen in Figure 4, believed to be the same as those of the 1912 eruption. Simulations were run from 2005 until 2009 and imported into a Geographical Information Systems program, which allowed a visual assessment of the distribution of ash. This data was cross-referenced with the locations of major international airports.
Once all this information was collated, the number of airports directly affected by the ash clouds was counted on each simulation. The totals and mean averages were calculated per week to discover a ‘worst-case’ scenario. This was based on passenger and financial information, which was obtained from the respective airport websites and reports by Tuck et al. (1992) on the 1989 Mount Redoubt eruption. These costs can be seen in Figure 5.
Results
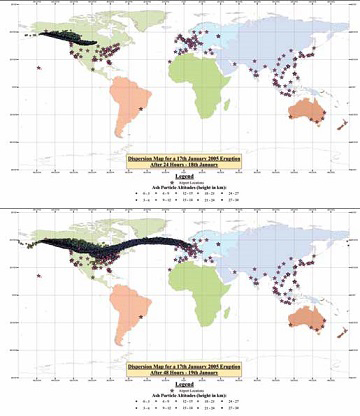
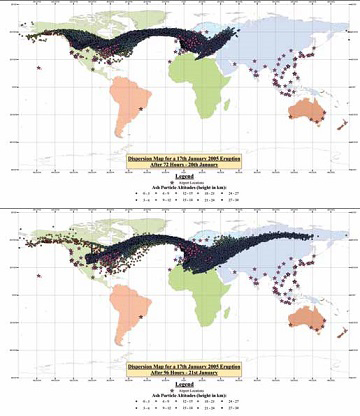
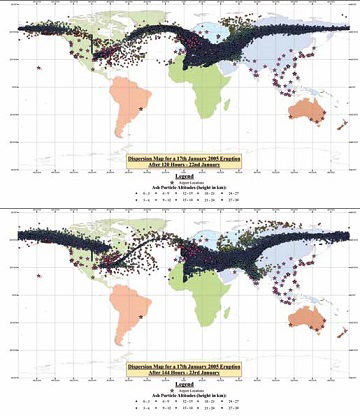
The ‘worst-case’ scenario turned out to be a simulation started on January 17, 2005, which directly affected 43.3 airports per day during the simulation, as well as an average of 7.6 airports per day that were close to the ash cloud path. The dispersion of this ash cloud can be seen in Figures 6-11.
Based on passenger numbers and how long the ash cloud was in the vicinity of the airport, a total loss figure was estimated for the seven days. The total cost for delayed and cancelled flights for the scenario was estimated over $322 million.
What Does This Mean For Alaska?
Although Alaska is part of the United States, it does not have the same infrastructure as the continguous 48 states. People would become stranded until the eruption deposits were cleaned up. As a state, it is reliant on food from mainland U.S.A. Alaska is dependent on aviation to supply remote villages and is not able to offer alternative transport. Aviation is particularly vital during the winter when roads are impassable due to snow. Supplies in these areas would quickly run out, causing extra health issues and putting people’s lives at risk.
Alaska is used as a midway-stop for ships and aeroplanes to refuel when travelling across the Pacific or Arctic. However, with it being one of the most volcanically active areas in the world, the area is highly at risk. Having planes grounded for many days, passengers waiting at airports and the cleaning of aviation areas (runways, aircraft, and airports) would be a significant financial strain on Alaska’s economy.
Alaska would suffer significantly both socially and economically from an eruption, from which it would be difficult to recover. It is likely many industries (such as the extensive fishing industry) would suffer, but the exact extent of the impact is difficult to calculate for this study.
What About the Rest of the World?
The estimated cost for this report does not include the landing fees for aircraft, the duty-free concessions, clean up and aircraft rerouting. As these figures stand, the cost of losing passengers is already three times more than that of Mount Redoubt in 1989/90, demonstrating the sheer potential impact of a large eruption. The simulations were only run for the equivalent to seven days, meaning costs are likely to be significantly higher.
All major flights from the U.S. to Asia, Australasia and some to the Middle East fly over Alaska. These areas of the world are heavily reliant on each other for commerce and consequently would be affected if an eruption of this scale occurred. The tourism industry would be heavily affected around the globe. Many industries would likely lose confidence in the reliance on aviation for the transport of goods as a result of the disruption. In this case, whilst airports would be expected to be affected all over the world, air traffic itself would likely not be possible throughout North America and Europe, making any operations very difficult as we are now so reliant on aircraft.
The Benefits of Longer Predictions
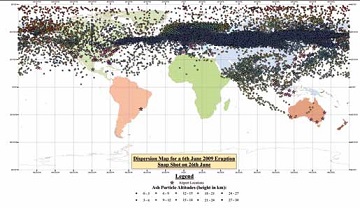
A simulation was run from June 6, 2009, to look at how the ash behaved over a longer period. In just 20 days, ash covered the whole of the northern hemisphere as well as southern India (Figure 12). If volcanic ash were to cross the equator, we could be in for a devastating situation. If Katmai, or even any volcano were to erupt at this magnitude again, it would cause global disruption. The simulation showed that an eruption of this size is not likely to dissipate quickly and could bring the world to a standstill.
Conclusions
Recent eruptions (in particular the April 2010 Eyjafjallajökull event) demonstrated the disruption a volcanic eruption could cause. The research demonstrated the potential devastation a bigger eruption could cause. If Novarupta erupted again today, to the same scale as in 1912, it would cripple the aviation industry in North America and possibly Europe. The minimum cost is estimated in excess of $300 million and the social implications are likely to be devastating all around the world.
The study demonstrates the need for a specific understanding of an eruption’s potential impact, and its wider social implications. There is still room for many developments of the project but it gives a basic overview of what we could be dealing with, maybe in our life time, if not in Alaska, somewhere else around the world.
Acknowledgements
I would like to thank Dr Peter Webley, Dr Derek Rust, and staff at the Alaskan Volcano Observatory and University of Alaska Fairbanks who provided information and support.
Rebecca Welchman can be reached by email at: rebecca.anne.welchman@hotmail.co.uk
References
Al Jazeera. 2010. Ash cloud disrupts global aviation. http://www.aljazeera.com/news/
Europe/2010/04/201041692933434631.html Accessed 16th April 2010.
Alaskan Volcano Observatory (AVO). Event Specific Information: Katmai -1912. (http://www.avo.alaska.edu/volcanoes/volcact.php?volcname=Katmai&eruptionid=494&page=basics) Accessed February 24, 2010.
Bureau of Transportation Statistics (BTS). 2009. Ted Stevens Anchorage International Airport, Alaska-air freight gateway. Research and Innovative Technology Administration, U.S. Department of Transportation. (http://
www.bts.gov/publications/americas_freight_transportation_gateways/2009/highlights_
of_top_25_freight_gateways_by_shipment_value/anchorage/index.html)
Chung A., and D. Pearse. 2010. Volcanic Ash Forces UK Flight Ban Extension. (http://news.sky.com/home/uk-news/article/15602425) Accessed April 16, 2010.
Dean, K.G., J. Dehn, K. Engle, P. Izbekov, K. Papp, and M. Patrick. 2002. Operational Satellite Monitoring of Volcanoes at the Alaska Volcano Observatory. Advances in Environmental Monitoring and Modelling 1(1): 70-97.
Fierstein, J., W. Hildreth, J.W. Hendley, and P.H. Stauffer. 1998. Can another Great Eruption Happen in Alaska? United States Geological Survey Fact Sheet 075-98.
Fierstein, J., and W. Hildreth. 2001. Preliminary Volcanic-Hazard Assessment for the Katmai Volcanic Cluster, Alaska. U.S Geological Survey. Anchorage, Alaska.
Fierstein, J. 2007. Explosive eruptive record in the Katmai Region, Alaska Peninsula: an overview. Bulletin of Volcanology 69: 469-509.
Kite-Powell, H.L. 2000. Benefits of NPOESS for commercial-aviation – Volcanic ash avoidance. Report to the
National Polar Orbiting Operational Environmental Satellite System (NPOESS) Integrated Program Office (IPO). Washington, D.C.
National Park Service (NPS). 2000. Geology Fieldnotes –Katmai National Park and Preserve, Alaska. In Description: 1912 Eruption of Novarupta, Alaska (vulcan.wr.usgs.gov/Volcanoes/Alaska/description_1912_
eruption_novarupta.html) Accessed 24th February 2010.
Topinka, L. 1999. Active Volcanoes and Plate Tectonics. (Vulcan.wr.usgs.gov/Glossary/PlateTectonics/
Maps/map_plate_tectonics_world2.html) Accessed September 6, 2010.
Tuck, B.H., L. Huskey, and L. Talbot. 1992. The Economic Consequences of the 1989-190 Mt. Redoubt Eruptions. U.S. Geological Survey.
Part of a series of articles titled Alaska Park Science - Volume 11 Issue 1: Volcanoes of Katmai and the Alaska Peninsula.
Last updated: July 26, 2016
