Part of a series of articles titled Alaska Park Science, Volume 18, Issue 1, Understanding and Preparing for Alaska's Geohazards.
Article
An Initial Assessment of Areas Where Landslides Could Enter the West Arm of Glacier Bay, Alaska and Implications for Tsunami Hazards
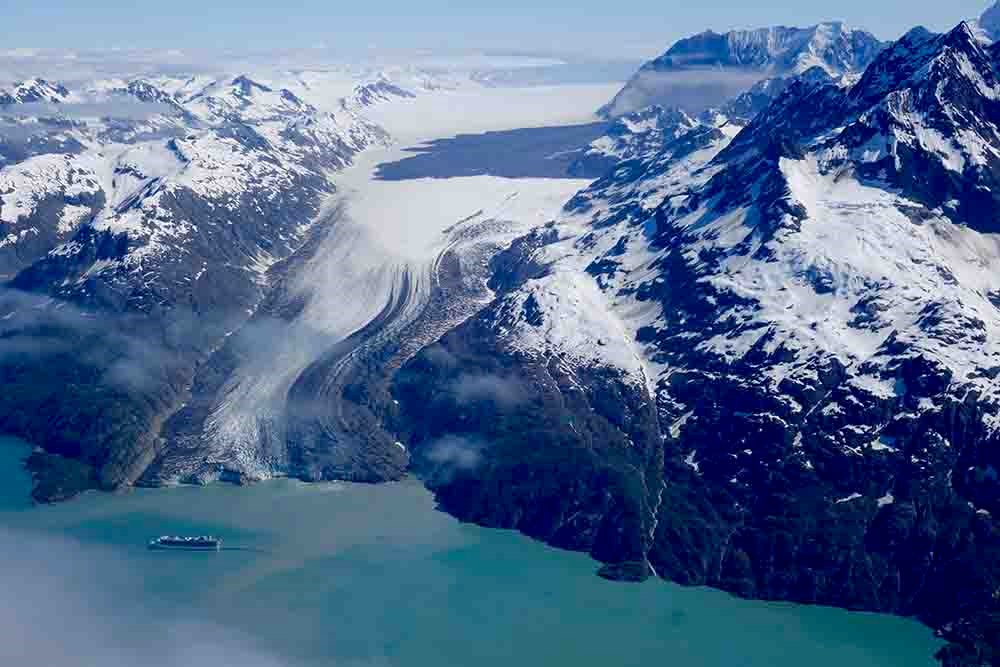
Photo courtesy of Paul Swanstrom, Mountain Flying Service
The combination of recent deglaciation, relatively frequent earthquakes, steep rocky slopes, and narrow inlets suggests that many locations in Glacier Bay have the potential for generating large tsunami waves.
Landslides and Giant Waves (National Park Service 2018a:1)
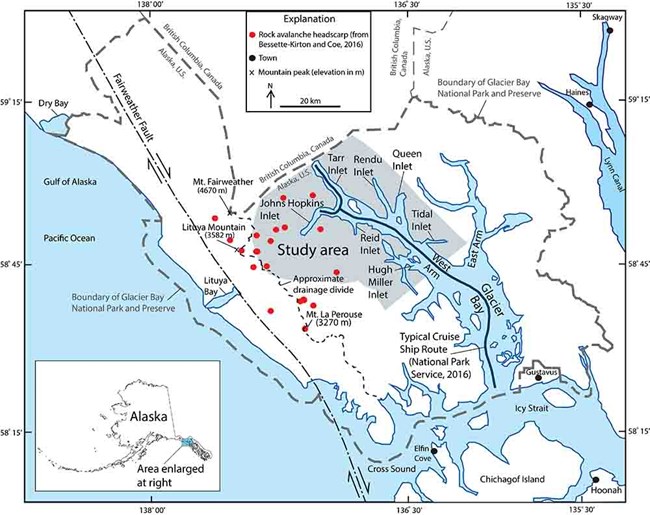
As implied by the quote above, Glacier Bay National Park and Preserve (GBNPP, Figure 1) is susceptible to tsunamis generated by landslides. Landslides capable of generating tsunamis include rockslides, rock avalanches, and soft-sediment slides that begin both above (subaerial) and below (submarine) water (e.g., Suleimani et al. 2015). Rock avalanches are landslides of fragmented rock that begin from rockslides and can be extremely hazardous because of their large size (>1 million (M) yard3 [>1 M m3]) and ability to move long distances (>0.6 mi [>1 km]) at extremely rapid speeds (up to 220 mi/hr [100 m/s], Pudasaini and Krautblatter 2014). GBNPP has a history of both earthquake- and climate-induced subaerial rockslides and rock avalanches (Miller 1960, Post 1967, Evans and Clague 1999, Geertsema 2012, Bessette-Kirton and Coe 2016, Coe et al. 2018, Bessette-Kirton et al. 2018). Throughout this article, we use the term landslide as a general term for all types of slope failures, including the three types listed above.
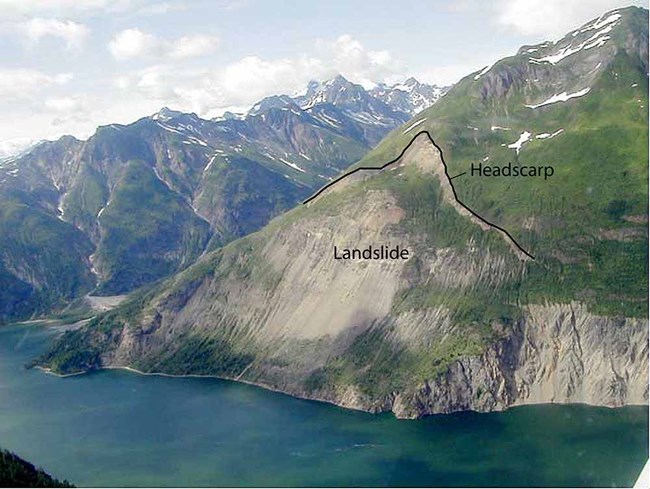
Although historical records of tsunamis generated by landslides in GBNPP are uncommon, there are records that document the extraordinary destructive power of at least three landslide-generated tsunamis in Lituya Bay on the west side of the park (Miller 1960). In 1958, when Lituya Bay was part of Glacier Bay National Monument (the area was established as a national park and preserve in 1980; National Park Service 2018b), the largest of these tsunamis was generated by a rockslide triggered by a M 7.8 earthquake (USGS 2018a) on the Fairweather Fault (Miller 1960; Figure 1). This rockslide was approximately 39 M yard3 (30 M m3) in volume and generated a tsunami that ran up the opposite shoreline to 1,719 feet (524 m) above sea level and killed two people in a small boat (Miller 1960, Fritz et al. 2009). Another rockslide at Tidal Inlet on the eastern side of the West Arm of Glacier Bay (Figures 1 and 2) appears to be active today. This slide has a volume of 6.5 to 14.5 M yard3 (5 to 11 M m3) and has been moving slowly (1-1.5 inch/yr [3-4 cm/yr] between 2002-2004) since at least 1892 (Wieczorek 2007). If catastrophic failure occurred, the landslide has the potential to generate a tsunami with waves >33 feet (>10 m) high in Glacier Bay proper near the mouth of the inlet (Geist et al. 2003; Wieczorek et al. 2007). The largest historical rock avalanche in GBNPP was the June 28, 2016 Lamplugh rock avalanche (Figure 1) with a volume of about 92 M yard3 (70 M m3; Bessette-Kirton et al. 2018). Luckily, this rock avalanche did not enter the water of the West Arm of Glacier Bay, but instead was deposited entirely on the Lamplugh Glacier. Another noteworthy rock avalanche occurred in October 2015 in Wrangell-St. Elias National Park and Preserve. This 99 M yard3 (76 M m3) rock avalanche traveled onto Tyndall Glacier and then into Taan Fiord where it generated a tsunami that ran about 623 feet (190 m) up the shoreline (Haeussler et al. 2018, Higman et al. 2018, Higman et al. this volume).
In 2017, about 540,000 people visited GBNPP on cruise ships and tour boats (National Park Service 2018b). Regulations that went into effect in January 2007 specify that a maximum of two cruise ships are allowed to enter Glacier Bay each day, year-round (Janiskee 2011). The typical cruise ship route traverses the entire length of Glacier Bay with two northern terminus points in the Johns Hopkins and Tarr Inlets to view glacier calving at the Johns Hopkins and the Grand Pacific glaciers, respectively (National Park Service 2016; Figure 1). The peak June-August cruise ship visitor season is also the season when climatically induced, subaerial-rockslides and rock avalanches are most likely to occur (Bessette-Kirton and Coe 2016, Coe et al. 2018). This temporal correspondence between high numbers of visitors and landslide hazard begs multiple questions, including:
- What areas of Glacier Bay are susceptible to rockslides or rock avalanches that could enter the water and potentially generate tsunamis?
- What is the likelihood that these slides and tsunamis could occur and how large will they be?
- If they occur, what is the risk to park visitors?
- If a substantial risk to visitors exists, what should be done about it?
None of these questions have easy answers, but in this article, we begin to address the first question and provide suggestions for approaches that could be used to better understand and quantify landslide and tsunami hazards and risk in GBNPP. We focus our initial effort on the West Arm of Glacier Bay where the cruise ship terminus points are located (Figure 1) and produce several maps that can be used to prioritize areas of the West Arm where additional work is needed. We concentrate this initial effort on landslides that initiate on land and then enter the water, because we currently know very little about landslides that initiate underwater in Glacier Bay.
Geologic Setting
Glacier Bay National Park and Preserve is located along the approximately 745-mile-long (1,200-km) transform boundary where the Pacific and North American tectonic plates slide past each other. The plate boundary is marked by two interconnected strike-slip faults, the Fairweather Fault in the north (e.g., Plafker et al. 1978), and the Queen Charlotte Fault in the south (e.g., Brothers et al. 2018). The Fairweather Fault, which is onshore in GBNPP (Figure 1), accommodates a large portion of the relative motion between the plates through dextral (right lateral) slip of about 1.5 inch/yr (43 mm/yr; Elliott et al. 2010).
Much of GBNPP is currently covered by ice, but the area has undergone extensive deglaciation during the last 250 years (Larsen et al. 2005, Connor et al. 2009). For example, in 1860, the entire West Arm of Glacier Bay (a fjord) was filled with ice. Viscoelastic rebound from deglaciation causes GBNPP to have one of the highest rates of uplift on Earth (up to about an inch/yr or 30 mm/yr; Larsen et al. 2005, see Husson et al. 2018 for global rates). Elevations in the area range from sea level up to 15,325 feet (4,671 m) at Mount Fairweather at the U.S.-Canada border (Figure 1). The combination of glacial scour, followed by deglaciation and extremely rapid uplift, has resulted in long, narrow inlets with steep, rocky walls that define Glacier Bay. These steep walls are periodically interrupted by tidewater glaciers that calve icebergs into the bay. At least nine tidewater glaciers terminate in inlets of the West Arm (Figure 1).
Bedrock in GPNPP is exposed at mountain peaks, flanks, and ridgelines, and in coastal zones. The bedrock geology is complex and consists of Paleozoic and Mesozoic accretionary terranes containing Tertiary sedimentary, intrusive, and volcanic rocks (Brew et al. 1978, Wilson et al. 2015). Bedrock units that surround the West Arm are: Tertiary, Oligocene, and Eocene granitic rocks; the Cretaceous Chugach accretionary complex consisting of flysch, graywacke, and basalts; Cretaceous and Jurassic quartz monzodiorite; Cretaceous foliated granitic rocks; and Devonian to Ordovician shale, chert, and argillite (Wilson et al. 2015). Gruber (2012a and 2012b) indicates a high likelihood that mountain permafrost is present in rock in high-elevation areas of GBNPP (see Gruber 2012b for map data and Coe et al. 2018 for historical landslides with respect to permafrost areas).
Processes Influencing Landslide and Tsunami Hazards
Landslides in rock are commonly triggered by shaking from earthquakes or by increases in pore-water pressures within rock fractures. The position of GBNPP along a tectonic plate boundary ensures that earthquakes capable of generating rock-slope failures have occurred and will continue to occur in the future. Since the 1958 M 7.8 earthquake that triggered the Lituya Bay rockslide and tsunami, there have been at least 90 earthquakes >M 4 within 62 miles (100 km) of the study area (the largest were two M 6.1 earthquakes, one in January 2000 and the other in July 2014; USGS 2019). However, we currently have no evidence that any of these earthquakes triggered rock-slope failures in the study area. Instead, all recent rockslides and rock avalanches in GBNPP have been associated with climatic triggers (Coe et al. 2018). Between 1984 and 2016, there were at least 24 climatically induced rock avalanches in GBNPP (Bessette-Kirton and Coe 2016) and available evidence indicates that these avalanches have increased in size and travel distance (mobility) with time (Coe et al. 2018).
There are at least four possible factors that could influence climatically induced landslides in GBNPP, these include: (1) degradation of mountain permafrost, (2) debutressing of rock slopes from thinning of glaciers, (3) increased precipitation, and (4) weakened rocks due to changes in regional crustal strain. The first three factors are related to ongoing climate change (e.g., Stevens et al. 2018). Geertsema and others (2013) summarized the impacts of the first two factors on national parks in Alaska, and Coe and others (2018) hypothesized that the first factor, the degradation of mountain permafrost, was the primary driver responsible for the observed increase in rock-avalanche size and travel distance in GBNPP. Mountain permafrost (ice within fractures in rocks) acts to strengthen rocks on steep slopes. However, well-documented increases in both long-term (e.g., Walsh et al. 2014) and short-term air temperatures (e.g., Walsh et al. 2017) degrade (weaken or thaw) permafrost, thus increasing the likelihood of large, hazardous rockslides and rock avalanches. Regarding the third factor, all climate projections show increasing long-term precipitation in Alaska through the end of the 21st century (van Oldenborgh et al. 2013, Walsh et al. 2014). This forecast, combined with increasing temperatures, can increase long-term pore-water pressures within rock fractures, thereby increasing the likelihood of landslides. The last factor is due to the location of GBNPP along an active tectonic plate boundary. In the interim between large earthquakes along this boundary, strain (deformation) in the crust accumulates and can structurally weaken rock masses, thereby leading to increased susceptibility to the first three factors that contribute to landslides.
The long and narrow geometry of inlets in Glacier Bay lend themselves to destructive tsunamis. Narrow inlets and fjords can cause amplification of waves and unpredictable wave oscillations from tsunamigenic landslides (e.g., Geist et al. 2003, Harbitz et al. 2014). Large variations in wave characteristics, inundation height, and current velocity can result from variations in local bathymetry and the irregular geometry of the coastline, and wave activity can last for hours after an initial wave (Harbitz et al. 1993, Geist et al. 2003, Harbitz et al. 2014).
Determining Where Landslides Could Cause Tsunamis
As previously stated, our primary goal in this article is to determine areas in the West Arm of Glacier Bay where subaerial landslides could enter the water and potentially initiate tsunamis. To meet this goal, we (1) determined subaerial areas that are susceptible to landslides, and (2) forecasted areas where these landslides could travel, including whether they could reach the water. Previous work has shown that the characteristics of tsunamis generated from subaerial landslides entering water are determined by both the landslide characteristics at impact with the water and by the dynamics of landslides once they are in the water (e.g., Mohammed and Fritz 2012, Yavari-Ramshe and Ataie-Ashtiani 2016).
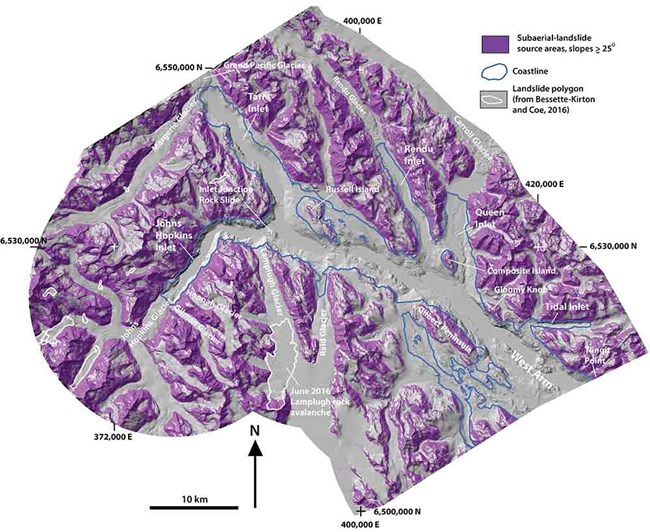
We currently lack detailed knowledge of geologic units, structures, and past failures along the coastline of Glacier Bay that could be used to define varying levels of subaerial landslide susceptibility. So, for our work, we assume that mountainsides that have adequate steepness to produce landslides, have equal potential to produce them. To delineate areas capable of generating landslides in GBNPP, we used data from Bessette-Kirton and Coe (2016). Specifically, we used headscarp locations for 24 rock avalanches in the Bessette-Kirton and Coe (2016) database and extracted slope values from a 10 m digital elevation model (DEM) for each location. These slope values showed that the rock avalanches initiated from slopes >26º. For our work in this article, we were slightly conservative and defined areas susceptible to landslides (source areas) as areas that had slope values >25º.
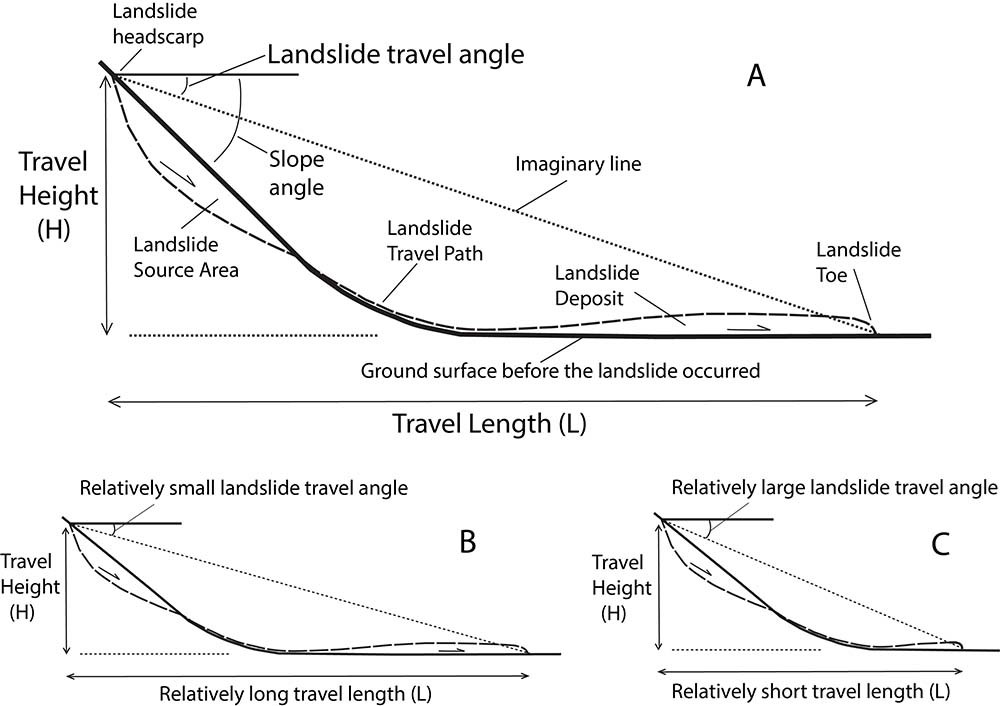
To estimate potential travel distances for landslides that initiate from source areas, we used landslide-travel angles (Figure 3) defined by landslide-travel height (H) and travel length (L) values contained in Bessette-Kirton and Coe (2016). A travel angle is the angle determined by an imaginary line connecting the landslide headscarp to the landslide toe, and, as such, should not be confused with slope angle, which is the inclination of the ground surface at any given location (Figure 3A). Landslides with low-travel angles have long travel distances compared to landslides with higher-travel angles (Figures 3B and C). Data from Bessette-Kirton and Coe (2016) showed that travel angles for the 24 historical rock avalanches ranged from 9 to 31º, with a mean value of 19º.
See Corominas (1996) for additional details.
We used the gravitational flow routing model Flow-R (Horton et al. 2013) to estimate potential-landslide travel distances. Flow-R has been used by the Geological Survey of Norway to model rockslides and rock avalanches in fjords, a very similar setting to Glacier Bay (Oppikofer et al. 2016). We used Flow-R to estimate landslide distances both on land and in the water. One limitation is that Flow-R does not distinguish differences in the physics controlling landslide movement and dynamics in these two environments. In other words, we used Flow-R to simulate a landslide-travel path across a continuous merged elevation surface of both subaerial and submarine topography. A similar subaerial and submarine landslide routing approach was used by Mazzanti and Bozzano (2011) to investigate the Scilla landslide and tsunami in southern Italy.
Input data for Flow-R consisted of a 30 m DEM of combined subaerial and submarine topography; our pre-defined landslide-source areas, which correspond to thousands of 30 m x 30 m DEM cells; and three travel angles, 9º, 19º, and 31º, which established thresholds for progressively higher levels of relative probability for landslide-travel distances. Subaerial DEM data were from the USGS National Elevation Dataset (USGS 2018b) and submarine data (i.e., bathymetric data) were from the National Oceanic and Atmospheric Administration (NOAA 2018). Within Flow-R, we used the modified Holmgren (1994) algorithm with a direction memory inertial algorithm (Horton 2018) to model the travel distance of landslides that could initiate from source areas. We used the three landslide-travel angles to define high, medium, and low levels of relative probability for landslide-travel distances. These different relative-travel probabilities can be interpreted as the relative probability of areas being impacted by landslides, with areas encompassed by high-travel angles having a higher probability of being impacted than areas defined by low-travel angles (see Figure 3B and C). This relative probability ranking is intuitive in that it indicates that areas closest to landslide-source areas will have a higher chance of being impacted than areas that are farther away from source areas.
Results and Implications
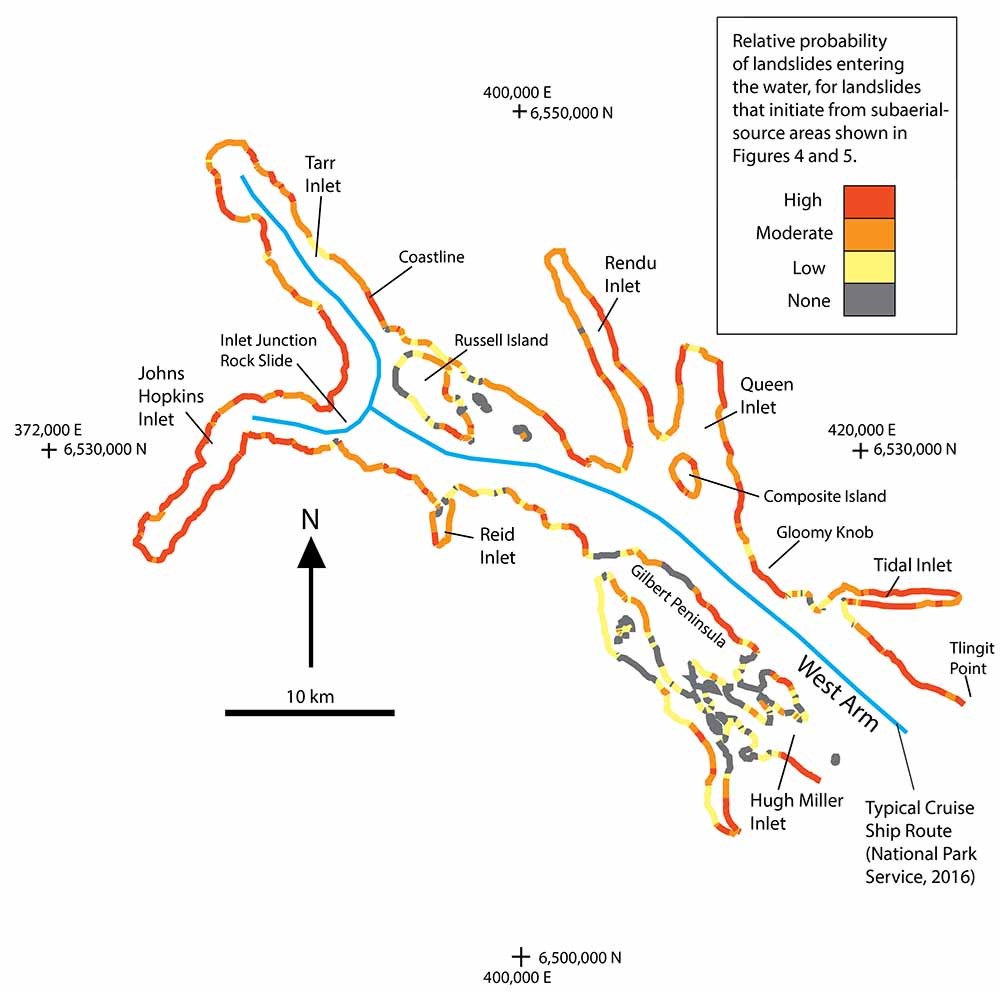
Subaerial locations that are susceptible to landslides surrounding the West Arm are shown in Figure 4. Figure 5 shows the relative probability of areas being impacted by landslides that initiate from subaerial source areas surrounding the West Arm. Figure 6 is a simplified version of Figure 5 in that it shows the relative probability for landslide impact at the coastline of the West Arm. Said another way, Figure 6 shows the relative probability of landslides entering the water along the coastline of the West Arm. Figures 5 and 6 indicate that there are large areas of moderate- to high-relative probability for landslide impacts in the Johns Hopkins, Tarr, Rendu, and Tidal Inlets. Other locations with extensive moderate to high probability of impact are the eastern and western shores of Queen Inlet, the eastern side of Gilbert Peninsula, the western side of Gloomy Knob, the eastern shore of the West Arm between Tidal Inlet and Tlingit Point. Figures 5 and 6 can be used to prioritize areas in and around the West Arm where further, more detailed subaerial landslide and landslide-generated tsunami investigations are needed.
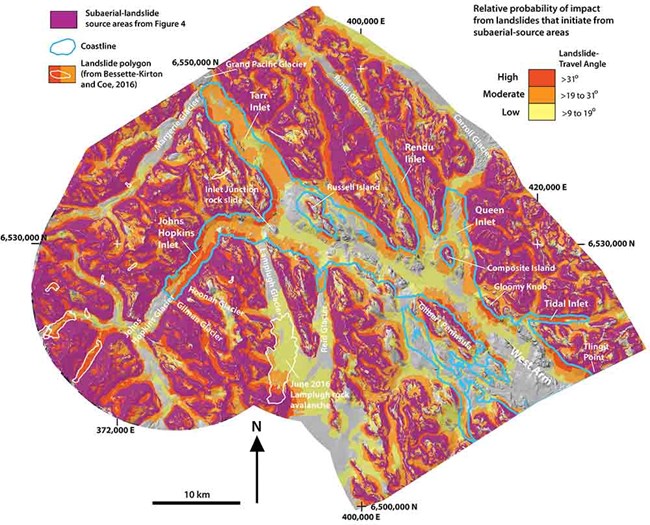
The boundary of each impact zone determined using travel angles from historical subaerial landslides. The coastline is shown with blue lines. The map does not portray impact zones for landslides that initiate from areas that are underwater. UTM zone 8.
Results shown in Figures 4, 5, and 6 do not account for landslides that initiate underwater. However, we examined the morphology of sub-marine features revealed by bathymetric data in our preparation of this article. Our examination led us to discover a large rockslide (Figure 7) near the junction of Johns Hopkins and Tarr Inlets (Figures 1, 4, 5, and 6), which we herein call the Inlet Junction rockslide (IJRS). We know the IJRS occurred sometime after 1892, because that is when the toe of the Johns Hopkins glacier covered the location where the landslide is located (e.g., Seramur et al. 1997). The deposit of the IJRS is almost entirely underwater, but the headscarp is above water and is clearly identifiable by its characteristic arcuate shape and higher elevation compared to the upper most, subaerial part of the deposit (Figure 7).
Based on the dimensions and cross section through the IJRS, we estimate that its minimum volume is about 105 M yard3 (80 M m3), which makes it the largest known landslide within GBNPP. The headscarp of the IJRS is delineated as a source area in Figure 4 and the deposit is in the moderate and low landslide-impact probability zones (Figure 5). The relatively low-travel angle indicates that the rockslide had a relatively long-travel distance (L; about 7,315 feet or 2,230 m) with respect to a relatively small change in elevation between the headscarp and the toe (H; about 1,410 feet or 430 m). This example highlights our knowledge gap regarding submarine landslides in Glacier Bay. For example, the relatively low-travel angle may be because the rockslide moved over and “loaded” water-saturated soft sediments. Loading of saturated sediments can rapidly elevate pore-water pressures within the sediments, which could work to enhance landslide travel distance. Another issue that is uncertain is whether or not this mostly submarine landslide would have caused a tsunami. Tsunami generation from landslides is based on the volume, dimensions, velocity, and internal deformation of the moving mass, as well as the depth of water (e.g., Ward 2001, Yavari-Ramshe and Ataie-Ashtiani 2016). Tsunami modeling at this location using a range of landslide volumes and dynamics would help to improve our understanding of tsunami hazards from submarine landslides in GBNPP.
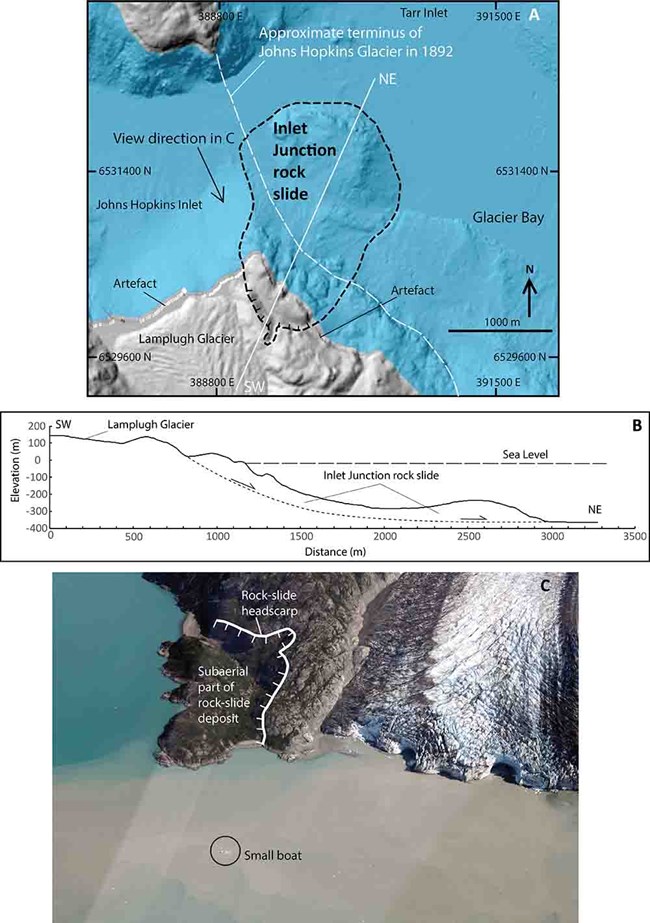
Image of Lamplugh Glacier taken July 13, 2009 by Mike and Susan Molloy. Width of the Lamplugh Glacier visible in this photo is about 2,625 feet (800 m). View is to the southeast.
To more accurately understand the subaerial landslide and landslide-generated tsunami hazards in the moderate- to high-probability landslide-impact areas (Figures 5 and 6), as well as other areas of Glacier Bay, several approaches could be taken. First, the moderate- to high-probability areas should be visited in the field to better characterize the geology at a scale appropriate for hazard assessments (1:20,000 or larger). This field work would serve to better differentiate landslide susceptibility. For example, it is possible that some areas of the bay that have been identified as having moderate-to-high landslide-impact probability, could have source areas with low susceptibility to failure, that is, they may be stable. Other areas, such as the Tidal Inlet landslide described by Wieczorek et al. (2007), would have a high-susceptibility ranking because of their history of movement. Second, for areas that are deemed to be highly susceptible to failure from field investigations, estimating landslide volumes and modeling landslide runout would enable an assessment of the size, character, and velocity of landslides that could enter the water. The acquisition of new, high-resolution topographic data (i.e., lidar data) for GBNPP would greatly aid this effort. Additionally, systematic monitoring of steep slopes along the coastline using remote sensing techniques such as interferometric synthetic-aperture radar (InSAR) or multitemporal photogrammetry could potentially be used to detect slow movement or deformation prior to catastrophic failure (e.g., Higman et al. 2018, Roberti et al. 2018). Lastly, as with submarine landslides, tsunami modeling to assess the size, velocity, and duration of waves generated from subaerial landslides entering the water would help to determine the size of a boat or ship that could be threatened by landslide-generated waves.
Acknowledgements
We thank Matthew Thomas, Eric Bilderback, Lisa Etherington, Chad Hults, Nina Chambers, Janet Slate, Leigh Welling, and Jim Lawler for their constructive reviews of this article. Thierry Oppikofer provided helpful advice regarding the use of Flow-R. Any use of trade, firm, or product names is for descriptive purposes only and does not imply endorsement by the U.S. Government.
References
Bessette-Kirton, E. K. and J. A. Coe. 2016.
Inventory of rock avalanches in western Glacier Bay National Park and Preserve, Alaska, 1984-2016. A baseline data set for evaluating the impact of climate change on avalanche magnitude, mobility, and frequency. U.S. Geological Survey data release, doi: 10.5066/F7C827F8
Bessette-Kirton, E. K., J. A. Coe, and W. Zhou. 2018.
Using stereo satellite imagery to account for ablation, entrainment, and compaction in volume calculations for rock avalanches on glaciers: Application to the 2016 Lamplugh rock avalanche in Glacier Bay National Park, Alaska. Journal of Geophysical Research - Earth Surface 123(4): 622-641. doi: 10.1002/2017JF004512
Brew, D. A., B. R. Johnson, D. Grybeck, A. Griscom, D. F. Barnes, A. L. Kimball, J. C. Still, and J.L. Rataj. 1978.
Mineral resources of the Glacier Bay National Wilderness study area, Alaska. U.S. Geological Survey Open-File Report 78-494, U.S. Geological Survey, Reston, Virginia, 670 p., 6 sheets, scale 1:125,000. https://pubs.er.usgs.gov/publication/ofr78494
Brothers, D. S., B. D. Andrews, M. A. L., Walton, H. G. Greene, J. V. Barrie, N. C. Miller, U. Ten Brink, East, A. E., P. J. Haeussler, J. W. Kluesner, and J. E. Conrad. 2018.
Slope failure and mass transport processes along the Queen Charlotte Fault, southeastern Alaska. Geological Society, London, Special Publications, 477. https://doi.org/10.1144/SP477.30
Coe, J. A., E. K. Bessette-Kirton, and M. Geertsema. 2018.
Increasing rock-avalanche size and mobility in Glacier Bay National Park and Preserve, Alaska detected from 1984–2016 Landsat imagery. Landslides 15(3): 393–407. https://doi.org/10.1007/s10346-017-0879-7
Connor, C., G. Streveler, A. Post, D. Monteith, and W. Howell. 2009.
The Neoglacial landscape and human history of Glacier Bay, Glacier Bay National Park and Preserve, southeast Alaska, USA. Holocene 19:381-393. doi: 10.1177/0959683608101389
Corominas, J. 1996.
The angle of reach as a mobility index for small and large landslides. Canadian Geotechnical Journal 33:260–271. doi: 10.1139/t96-005
Elliott, J. L., C. F. Larsen, J. T. Freymueller, and R. J. Motyka. 2010.
Tectonic block motion and glacial isostatic adjustment in southeast Alaska and adjacent Canada constrained by GPS measurements. Journal of Geophysical Research 115, B09407, doi:10.1029/2009JB007139
Evans, S.G., and J. J. Clague. 1999.
Rock avalanches on glaciers in the Coast and St. Elias Mountains, British Columbia. In: Slope stability and landslides. Proceedings of the 13th Annual Geotechnical Society Symposium, Vancouver, B.C., 115-123. https://www.researchgate.net/publication/283476315_Rock_avalanches_on_glaciers_in_the_Coast_and_St_Elias_Mountains_British_Columbia
Fritz, H. M., F. Mohammed, and J. Yoo. 2009.
Lituya Bay landslide impact generated mega-tsunami. 50th anniversary: Pure and Applied Geophysics 166:153-175, doi:10.1007/s00024-008-0435-4
Geist E. L., M. Jakob, G. F. Wieczorek, and P. Dartnell. 2003.
Preliminary hydrodynamic analysis of landslide-generated waves in Tidal Inlet, Glacier Bay National Park, Alaska. U.S. Geological Survey Open-File Report 03-411, 20 p. https://pubs.usgs.gov/of/2003/0411/
Geertsema, M. 2012.
Initial observations of the 11 June 2012 rock/ice avalanche, Lituya Mountain, Alaska. The First Meeting of Cold Region Landslides Network, Harbin, China, 5 p. 10.13140/2.1.2473.5682
Geertsema, M., J .J. Clague, and A. Hasler. 2013.
Influence of climate change on geohazards in Alaskan Parks. Alaska Park Science 12:81-85. http://www.nps.gov/akso/nature/science/ak_park_science/PDF/Vol12-2/APS_Vol12-Issue2_complete.pdf
Gruber, S. 2012a.
Derivation and analysis of a high resolution estimate of global permafrost zonation. The Cryosphere 6:221-233. doi:10.5194/tc-6-221-2012
Gruber, S. 2012b.
Global Permafrost Zonation Index Map. Available at: http://www.geo.uzh.ch/microsite/cryodata/pf_global/ (accessed July, 2017)
Haeussler, P. J., S. P. S. Gulick, N. McCall, M. Walton, R. Reece, C. Larsen, D. H. Shugar, M. Geertsema, J. G. Venditti, and K. Labay. 2018.
Submarine deposition of a subaerial landslide in Taan Fiord, Alaska. Journal of Geophysical Research – Earth Surface 123(10):2443-2463. https://doi.org/10.1029/2018JF004608
Harbitz, C. B., S. Glimsdal, F. Løvholt, V. Kveldsvik, G. K. Pedersen, and A. Jensen. 2014.
Rockslide tsunamis in complex fjords: From an unstable rock slope at Åkerneset to tsunami risk in western Norway. Coastal Engineering 88: 101-122.
Harbitz, C. V., G. Pedersen, and B. Gjevik. 1993.
Numerical simulations of large water waves due to landslides. Journal of Hydraulic Engineering 119(12): 1325-1342.
Higman, B., D. H. Shugar, C. P. Stark, G. Ekström, M. N. Koppes, P. Lynett, A. Dufresne, P. J. Haeussler, M. Geertsema, S. Gulick, A. Mattox, J. G. Venditti, M. A. L. Walton, N. McCall, E. Mckittrick, B. MacInnes, E. L. Bilderback, H. Tang, M. J. Willis, B. Richmond, R. S. Reece, C. Larsen, B. Olson, J. Capra, A. Ayca, C. Bloom, H. Williams, D. Bonno, R. Weiss, A. Keen, V. Skanavis, and M. Loso. 2018.
The 2015 landslide and tsunami in Taan Fiord, Alaska. Scientific Reports 8:12993. doi: 10.1038/s41598-018-30475-w
Holmgren, P. 1994.
Multiple flow direction algorithms for runoff modelling in grid based elevation models: An empirical evaluation. Hydrologic Processes 8: 327–334, doi:10.1002/hyp.3360080405.
Horton, P., M. Jaboyedoff, B. Rudaz, and M. Zimmermann. 2013.
Flow-R, a model for susceptibility mapping of debris flows and other gravitational hazards at a regional scale. Natural Hazards Earth System Science 13:869-885, doi:10.5194/nhess-13-869-2013.
Horton, P. M. 2018.
Flow-R software web site. Available at: http://www.flow-r.org/ (accessed September 2, 2018)
Husson, L., T. Bodin, G. Spada, G. Choblet, and C. Kreemer. 2018.
Bayesian surface reconstruction of geodetic uplift rates: Mapping the global fingerprint of glacial isostatic adjustment. Journal of Geodynamics 122: 25-40. https://doi.org/10.1016/j.jog.2018.10.002
Janiskee, B. 2011.
By the numbers: Glacier Bay National Park and Preserve: National Parks Traveler. Available at: https://www.nationalparkstraveler.org/2011/06/numbers-glacier-bay-national-park-and-preserve8248 (accessed on February 17, 2019)
Larsen, C. F., R. J. Motyka, J. T. Freymueller, K. A. Echelmeyer, and E. R. Ivins. 2005.
Rapid viscoelastic uplift in southeast Alaska caused by post-Little Ice Age glacial retreat. Earth and Planetary Science Letters 237: 548-560. doi: 10.1016/j.epsl.2005.06.032
Mazzanti, P. and F. Bozzano. 2011.
Revisiting the February 6th 1783 Scilla (Calabria, Italy) landslide and tsunami by numerical simulation. Marine Geophysical Research 32:273-286. doi: 10.1007/s11001-011-9117-1.
Miller, D. J. 1960.
Giant waves in Lituya Bay Alaska. U.S. Geological Survey Professional Paper 354-C, pp. 51-86, one 1:50,000 scale sheet. https://pubs.usgs.gov/pp/0354c/report.pdf
Mohammed, F. and H.M. Fritz. 2012.
Physical modeling of tsunamis generated by three-dimensional deformable granular landslides. Journal of Geophysical Research 117:C11015. doi:10.1029/2011JC007850
National Park Service. 2016.
Typical cruise ship route in Glacier Bay. Available at: https://www.nps.gov/glba/planyourvisit/typical-cruise-ship-route-in-glacier-bay.htm (accessed on August 16, 2018)
National Park Service. 2018a.
Landslides and Giant Waves. Available at: https://www.nps.gov/glba/planyourvisit/landslides-and-giant-waves.htm (accessed on August 19, 2018)
National Park Service. 2018b.
Glacier Bay: 2018 Fact Sheet. Available at: https://www.nps.gov/glba/learn/management/glacier-bay-fact-sheet.htm (accessed July 10, 2018)
NOAA. 2018.
Bathymetry data. Available at: https://maps.ngdc.noaa.gov/viewers/bathymetry/ (accessed August 2018)
Oppikofer, T., R. L. Hermanns, G. Sandøy., M. Böhme, M. Jaboyedoff, P. Horton, N. J. Roberts, and H. Fuchs. 2016.
Quantification of casualties from potential rock-slope failures in Norway. In: Aversa, S., Cascini, L., Picarelli, L., and Scavia, C., Landslides and Engineered Slopes, Experience, Theory, and Practice. CRC Press, pp. 1537-1544.
Pflaker, G., T. Hudson, T. Bruns, and M. Rubin. 1978.
Late Quaternary offsets along the Fairweather fault and crustal plate interactions in southern Alaska. Canadian Journal of Earth Sciences 15:805-816. doi: 10.1139/e78-085
Post, A. 1967.
Effects of the March 1964 Alaska earthquake on glaciers. U.S. Geological Survey Professional Paper 544-D, 42 p. https://pubs.usgs.gov/pp/0544d/
Pudasaini, S. P. and M. Krautblatter. 2014.
A two-phase mechanical model for rock-ice avalanches. Journal of Geophysical Research 119(10): 2272–2290. https://doi.org/10.1002/2014JF003183
Roberti, G., B. Ward, B. van Wyk de Vries, P. Friele, L. Perotti, J.J. Clague, and M. Giardino. 2018.
Precursory slope distress prior to the 2010 Mount Meager landslide, British Columbia. Landslides 15:637-647. doi: 10.1007/s10346-017-0901-0
Seramur, K., R. Powell, and P. Carlson. 1997.
Evaluation of conditions along the grounding line of temperate marine glaciers: an example from Muir Inlet, Glacier Bay, Alaska. Marine Geology 140:307-327.
Stevens, D., G. Wolken, T. Hubbard, and K. Hendricks. 2018.
Landslides in Alaska: Alaska Division of Geological & Geophysical Surveys Circular 65, 2 p. http://doi.org/10.14509/29849
Suleimani, E., D. Nicolsky, and R. Koehler. 2015.
Tsunami inundation maps of Elfin Cove, Gustavus, and Hoonah, Alaska: Alaska Division of Geological & Geophysical Surveys, Report of Investigations 2015-1, 79 p., 3 map sheets. http://dggs.alaska.gov/pubs/id/29404
USGS. 2018a.
Earthquake Hazards earthquake catalog. https://earthquake.usgs.gov/earthquakes/eventpage/iscgem884702#executive
USGS. 2018b.
National Elevation Dataset (NED) web site. Available at: http://nationalmap.gov/elevation.html (accessed August 2018)
USGS. 2019.
Earthquake Hazards earthquake catalog. Available at: https://earthquake.usgs.gov/earthquakes/search/ (accessed February 2019)
van Oldenborgh, G. J., M. Collins, J. Arblaster, J. H. Christensen, J. Marotzke, S. B. Power, M. Rummukainen, and T. Zhou. 2013.
Annex I: Atlas of global and regional climate projections. In: Stocker, T. F., Qin, D., Plattner, G. -K., Tignor, M., Allen, S. K., Boschung, J., Nauels, A., Xia, Y., Bex, V., Midgley, P. M., (eds.), Climate Change 2013: The Physical Science Basis. Contribution of Working Group I to the Fifth Assessment Report of the Intergovernmental Panel on Climate Change. Cambridge University Press, Cambridge and New York, NY, pp. 1311-1393. https://www.ipcc.ch/pdf/assessment-report/ar5/wg1/WG1AR5_AnnexI_FINAL.pdf
Walsh, J., D. Wuebbles, K. Hayhoe, K. Kossin, K. Kunkel, G. Stephens, P. Thorne, R. Vose, M. Wehner, J. Willis, D. Anderson, S. Doney, R. Feely, P. Hennon, V. Kharin, T. Knutson, F. Landerer, T. Lenton, J. Kennedy, and R. Somerville. 2014.
Chapter 2: Our changing climate. In: Melillo, J. M., Richmond, T. C., Yohe G. W., (eds.), Climate change impacts in the United States: The third national climate assessment, U.S. Global Change Research Program. pp. 19-67. http://nca2014.globalchange.gov/report
Walsh J. E., P. A. Bieniek, B. Brettschneider, E. S. Euskirchen, R. Lader, and R. L. Thoman. 2017.
The exceptionally warm winter of 2015/16 in Alaska. Journal of Climate 30:2069–2088. https://doi.org/10.1175/JCLI-D-16-0473.1
Ward, S. N. 2001.
Landslide tsunami. Journal of Geophysical Research 106(6):11,201-11,215.
Wieczorek, G. F., M. Jakob, R. J. Motyka, S. L. Zirnheld, and P. Craw. 2003.
Preliminary assessment of landslide-induced wave hazards: Tidal Inlet, Glacier Bay National Park, Alaska: U.S. Geological Survey Open File Report 03-100. https://pubs.usgs.gov/of/2003/ofr-03-100/ofr-03-100.html
Wieczorek, G. F., E. L. Geist, R. J. Motyka, and M. Jakob. 2007.
Hazard assessment of the Tidal Inlet landslide and potential subsequent tsunami, Glacier Bay National Park, Alaska. Landslides 4:205-215. doi: 10.1007/s10346-007-0084-1
Wilson, F. H., C. P. Hults, C. G. Mull, S. M. Karl. 2015.
Geologic map of Alaska: U.S. Geological Survey Scientific Investigations Map 3340, 197 p., 2 sheets, scale 1:584,000, doi: 10.3133/sim3340.
Yavari-Ramshe, S. and B. Ataie-Ashtiani. 2016.
Numerical modeling of subaerial and submarine landslide-generated tsunami waves–recent advances and future challenges. Landslides 13:1325-1368. doi:10.1007/s10346-016-0734-2
Last updated: October 26, 2021
