Part of a series of articles titled Alaska Park Science, Volume 18, Issue 1, Understanding and Preparing for Alaska's Geohazards.
Article
Catastrophic Glacier Collapse and Debris Flow at Flat Creek
Michael Loso, National Park Service
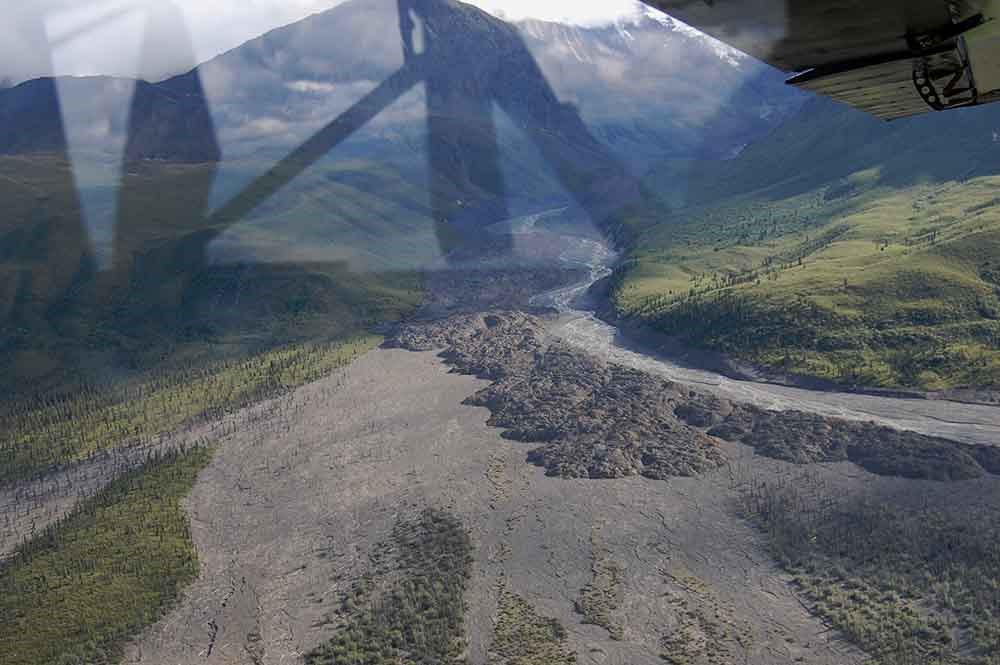
We later determined, using additional historic photos and data from nearby seismometers, that the lumpy deposit in the mouth of the valley was deposited by a debris flow in August 2013. Photo courtesy of Jeff Trop, Bucknell University
On July 15, 2015, Bucknell University geologist Jeff Trop was studying regional tectonics of the eastern Wrangell Mountains when his small aircraft happened to pass over a messy looking debris deposit on the south bank of the White River. The deposit, at the mouth of a small tributary valley known locally as Flat Creek, appeared large, recent, and out of character with the braided glacier stream deposits that dominate the area. Trop snapped some pictures (Figure 1), shared them with some colleagues, and in the process revealed yet another example (like the Taan Fiord landslide tsunami) of a landscape-altering geologic event. It had gone unnoticed for several years by park visitors and staff in our largest and, arguably, wildest park in the National Park System: Wrangell-St. Elias National Park and Preserve.
If anyone was close enough to witness the event that deposited the debris, they could easily have been killed. Luckily, no one was there to see it happen. Although, it actually didn’t go completely unnoticed. Tom Vaden, a long-time seasonal resident at Solo Creek on the opposite side of the White River, remembered hearing and feeling a large shock from the direction of Flat Creek in mid-summer 2013. On later inspection, he found an impressive deposit, rich in ice and mud, burying white spruce forests almost to the White River. And Vaden also recalled an even larger mass flow coming down the same creek in 2015, just days after Trop took those fortuitous photos.
The scant evidence initially available—mainly anecdotal reports and a few scattered photographs—clearly demonstrated that some sort of debris-flow-like event had occurred at least twice on Flat Creek (Figure 2). Available satellite imagery helped narrow down the search, but it was up to U. S. Geological Survey (USGS) seismologist Kate Allstadt to confirm the timing. Seismometers near Barnard Glacier, 40 miles (65 km) SSE of Flat Creek, recorded the events because they shook the ground hard, just as resident Tom Vaden had described. In fact, the seismic data (Figure 3) tell us that there were two main slope failures: the first one was recorded on August 5th, 2013 and a second one was recorded almost exactly two years later, on July 31st, 2015. The second one was a very large detachment followed by two smaller events, all within half an hour of each other. And then, while we were just beginning to piece together the story in 2016, another event was witnessed.
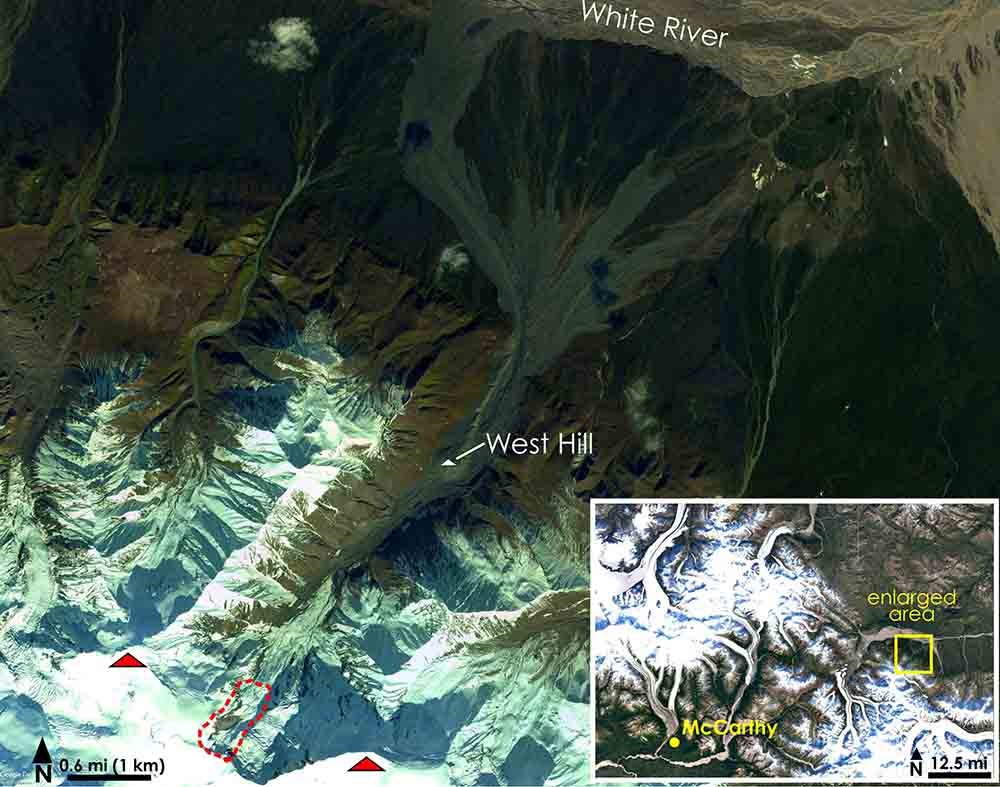
Two glaciated peaks (red triangles) form the headwaters of Flat Creek at the southwest end of the valley. The red dashed line shows the approximate boundary of the glacial source area for the debris flows; see Figure 4 for more detail.
National Park Service rangers Luke Wassink and Peter Christian were flying a routine hunting patrol on August 10th, 2016, when they happened to be passing over the Flat Creek area. In an amazing coincidence, they looked down just in time to witness an icy debris avalanche flowing down the river channel at almost 25 mph (40 km/h). They caught the event on video, and quickly shared it with park geologist Mike Loso. The flow they recorded (in a video available here) is much smaller than the 2013 and 2015 events—a conclusion supported by the seismic data—but it’s nevertheless a dramatic sight. The flow is extremely wet and it appears to be carrying more ice than mud. In this way, it seems to differ from the earlier events, which we assume based on their deposits, carried very large volumes of silt, sand, gravel, and even larger material. They had seemed, in other words, to be classic debris flows.
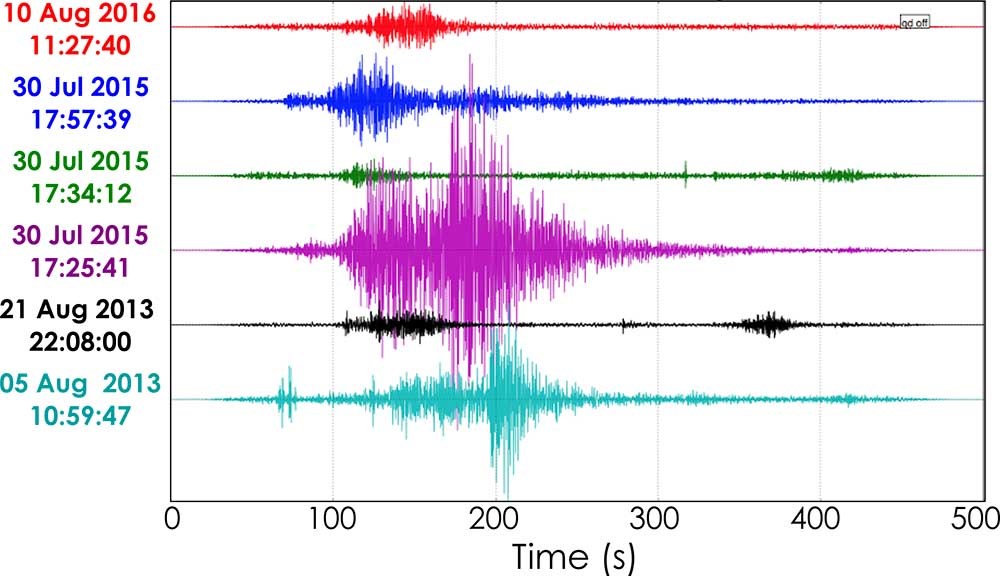
In the long run, we hope that these data will also tell us something about the dynamics of the slides. Data Source: Kate Allstadt, USGS.
Debris flows are common processes in mountain regions, including those of Alaska’s parks, where large amounts of debris can accumulate in narrow stream valleys (Costa 1984). When the time is right, usually coincident with intense snowmelt or strong rainfall, much of the accumulated debris may be washed down the valley. Debris flows can be highly mobile and travel for long distances, especially when they come raging down steep streambeds. In his 1988 essay, Los Angeles against the Mountains, author John McPhee (1988) described a debris flow this way:
It was not a landslide, not a mudslide, not a rock avalanche, nor by any means was it the front of a conventional flood. In geology, it would be known as a debris flow. Debris flows amass in stream valleys and more or less resemble fresh concrete. They consist of water, mixed with a good deal of solid material, most of which is above sand size. Some of it is Chevrolet size.
Though we didn’t witness them, it appears that the 2013 and 2015 events, based on what we can tell from their deposits, fit McPhee’s description reasonably well. Except that they also contained ice, according to Tom Vaden. The 2016 event captured on video, which carried mostly ice, hardly resembled McPhee’s description. We might call it a slushalanche, but that’s a term without precedent in the scientific literature. Even the earlier events appeared to have been quite wet and ice rich, which forced us to confront two central questions in our research: what is causing these flows and where is all the ice and water coming from?
As a starting point for answering those questions, we used satellite data to compare images and elevations from before and after the slides to identify the changes that took place during each event. Frequent cloud cover in this part of the world makes it hard to track changes in satellite images, but Planet Lab’s army of small cube satellites passes over the area very often (Planet Team 2017). Their high-resolution data (pixel size=16.4 feet [5 m]) provided a valuable resource to track the changes as closely as possible. Vast areas of white spruce forest were overrun by the 2013 and 2015 events. In the lower part of the valley, the 2013 flow left a narrow deposit of debris 2.3 miles (3.7 km) long and 260-820 feet (80-250 meters) wide. In some places, the deposit is more than 65 feet (20 m) thick. Two years later, once again during peak melt season in mid-summer, the second slide bulldozed down the valley. In 2013, the flow had deposited debris atop what we informally named West Hill (Figure 2), a riverside knob that stands more than 300 feet (100 meters) tall. The 2015 flood was even bigger, overflowing the entire hill leaving a wide path of destruction. It travelled over the top of the 2013 deposit, destroyed yet more spruce forest, and covered almost 3,700 acres (or ~2,800 American football fields).
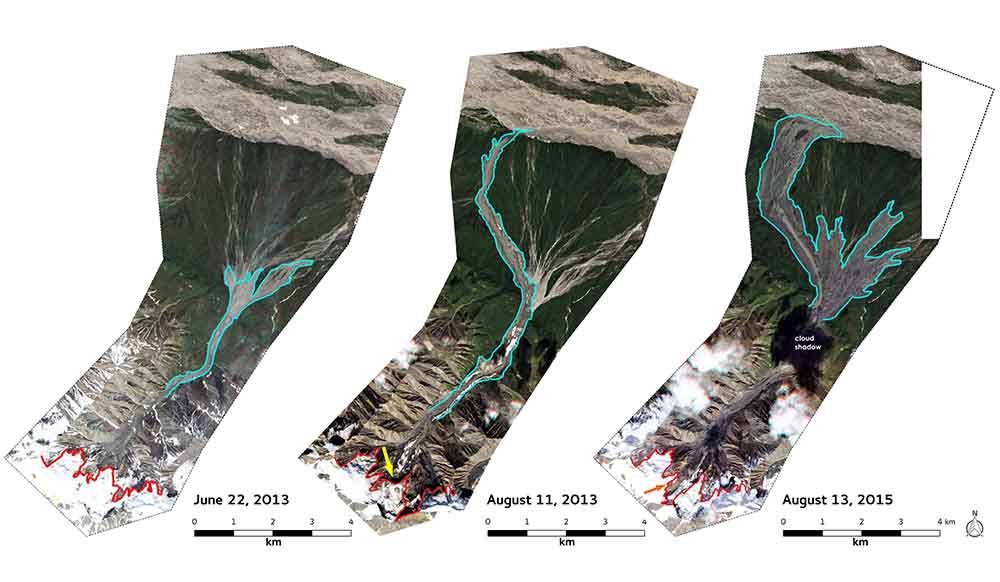
A prominent tongue of the glacier has gone missing and a long, skinny debris-flow deposit is visible all the way down to the White River. Right panel (August 2015) shows a vast debris deposit on the fan and much of the glacier missing.
The most notable observation from those satellite images, however, is that large parts of the glacier that occupied the head of Flat Creek disappeared during the 2013 and 2015 events. An image from 11 August 2013 shows that the front third of the glacier tongue were missing and large pieces of ice flanked the river below. In 2015, the ice in the central trough of the glacier disappeared altogether (Figure 4). To better understand these apparently sudden ice losses, we used digital surface models (DSM or DEM for digital elevation model) to quantify changes in glacier surface elevation. DSMs were available to us for the years 2012 (AK IfSAR DSM based on airborne synthetic aperture radar), 2014 and 2016 (ArcticDEM made from optical satellite images, available at no cost through the Polar Geospatial Center). These products are spaced just right to bracket the individual events in 2013 and 2015. Comparing these datasets revealed that about 244-395 million cubic feet (6.9-11.2 million m3 or roughly 4,000 Olympic swimming pools) and 614-965 million cubic feet (17.4-19.7 million m3 or ~7,200 Olympic pools) of the upper Flat Creek basin washed downstream in the 2013 and 2015 events, respectively (Figure 5).
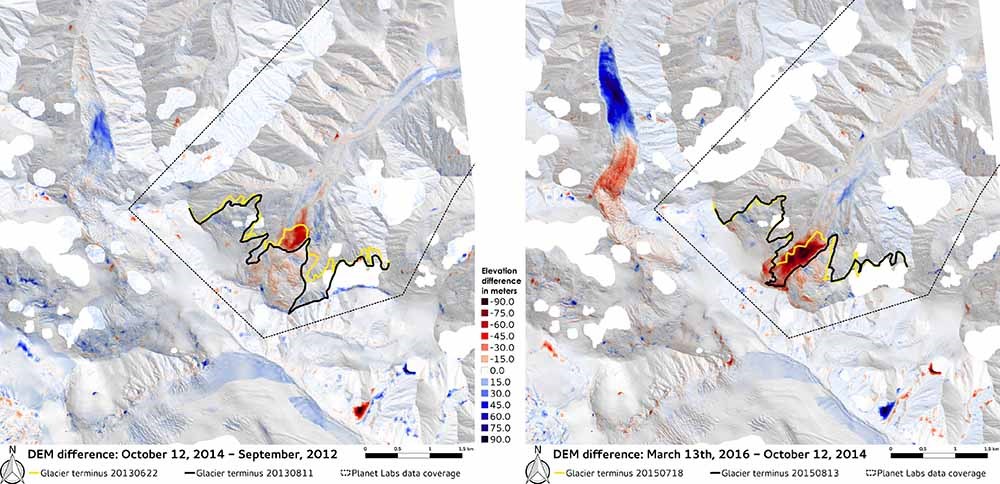
In each panel, elevation loss is shown in shades of red and elevation gain in shades of blue. Digitized before-event and after-event glacier terminus outlines are drawn in black and yellow. Note the initiation and rapid progress of a glacier surge.
These volume losses were concentrated almost entirely in the glacier-covered areas of the watershed and, importantly, included not just the glacier terminus, but ice up to and including the highest portions of the accumulation zone. Because the 2013 and 2015 events transported large amounts of sediment, we know that the volume losses we calculated from DEMs are not solely due to ice loss; some of the volume removed from the upper watershed had to have included subglacial bedrock or sediment. But the inescapable conclusion remains: those events (including the 2016 event, which obviously contained a large volume of glacier ice even though we have not been able to determine where it came from) involved the substantial, nearly instantaneous collapse of a large, full-thickness section of the Flat Creek Glacier.
While both satellite data and DEMs are useful for identifying large-scale changes at Flat Creek, they can only tell us so much about the process that drove these catastrophic events. In order to better understand them, and to evaluate the threat similar events might pose to visitors and infrastructure in the parks and elsewhere, we conducted the first on-site field investigation of Flat Creek during summer 2018.
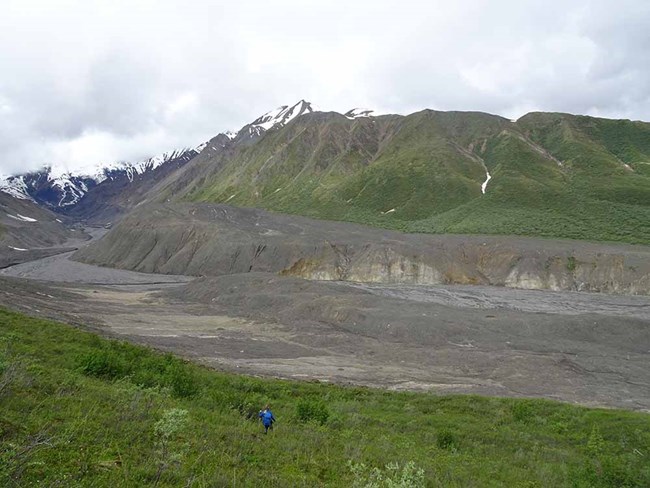
West Hill, 360 feet (109 meters) tall is visible on the far side of the creek just inside the large bend in the river. Photo courtesy of Mylène Jacquemart, CU Boulder
Without question, our first and strongest im-pression from the site of the debris flows was how overwhelmingly big these events were (Figure 6). The runout distance of approximately 7 miles (11.26 km) is astounding, especially given that the maximum fall height from glacier crest to valley floor is only about 4,900 feet (1,500 m). Because of how well the glacier extent matches the failure outline, we argue that this is not a case of a glacier getting caught in a rock avalanche. Instead, we believe that the glacier detached from its bed, entraining rock and debris. We are only aware of three places in the world where catastrophes of similar magnitude and character (long, low-angle runouts associated with sudden upstream glacier collapse) have occurred: the 2002 detachment of Kolka Glacier in the Russian Caucasus (Evans et al. 2009), the 2016 failures of two glaciers in northern Tibet (Kääb et al. 2018), and several glacier detachments at Iliamna, a volcano in Cook Inlet, Alaska (Caplan-Auerbach and Huggel 2007).
Another conspicuous feature of the deposit is the absence of boulders. McPhee’s “Chevrolet-sized boulders” are almost completely missing from the runout zone. Hardly anything larger than a toy truck seems to have survived this slide. Part of the reason for that is likely the quality of rock that makes up the headwall, where the slide originated. It is composed of dark grey and reddish brown mudstone, mapped in this region as part of the early Permian Hasen Creek Formation. Importantly, the headwall also lines up with the late Quaternary Totschunda Fault, though we found no seismic triggers for the collapse. The primary strand of the fault itself is not obviously visible in Flat Creek, but the bedrock in the area exhibits numerous faults, igneous intrusions, and possibly thermal alterations that collectively compromise these already weak sedimentary rocks.
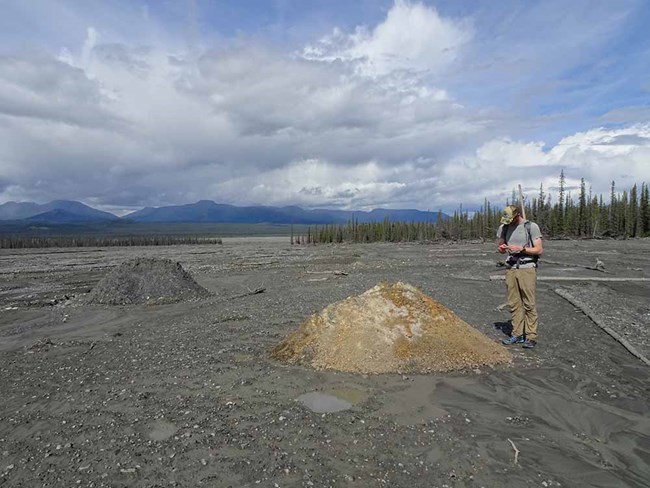
We interpret the molards as blocks of weak (but perhaps frozen) bedrock that were transported whole by the debris flow, but then disintegrated after deposition. Photo courtesy of Jasmine Hansen, CU Boulder.
The low quality of the rock is further illustrated by conical debris mounds, termed molards, that we found throughout the deposit. Several hypotheses have been formulated to explain molards, but in this instance, we favor some newer evidence suggesting that molards are often a product of landsliding in permafrost terrain. Boulder-sized clasts of weak bedrock cemented by ice get transported to lower elevation sites, where they thaw and fall apart to form conical mounds (Brideau et al. 2009, Milana 2016). Their generally homogenous physical properties (Figure 7) supports the interpretation of each molard as a transported instance of a single coherent rock type (rather than transport of a previously mixed material moved by glaciers and deposited by streams [glaciofluvial] or loose, unconsolidated [colluvial] sedimentary deposit).
This interpretation is supported by our observation that frozen ground (in mid-July) was present at a depth of 31.5 inches (80 cm) and that we measured a ground temperature of only 34.2°F (1.2°C) at a depth of 27.5 inches (70 cm). While a single measurement is not conclusive, it suggests that the source area, at least where unglaciated, contains permafrost (permanently frozen ground). Our findings are also supported by the permafrost map created by Jorgenson and others (2008), which suggests that permafrost is present in more than 90% of Flat Creek basin. This may be relevant because several studies have tied warming permafrost to a potential increase in landslide activity (Huggel et al. 2012).
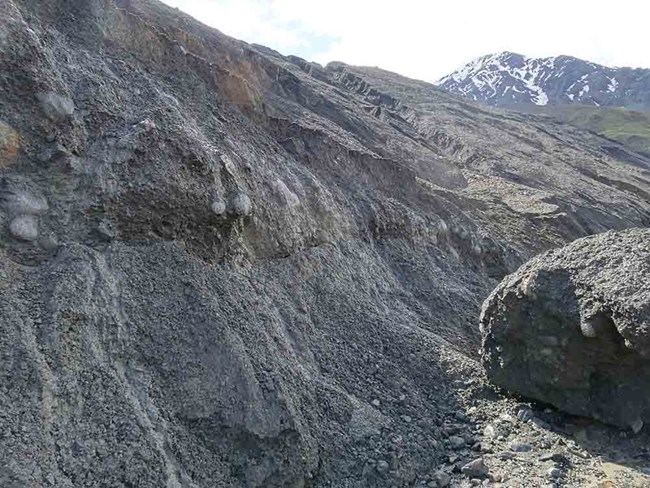
The light-colored, rounded clasts are composed of ice. Very little sediment is needed to shield ice from the warmth of the sun, so it is possible that some of this ice is left over from the earliest 2013 event. Photo: Mylène Jacquemart, CU Boulder
Along the drainage toward the headwall, we found numerous stream-eroded outcrops of ice-rich debris. The ice was, in most cases, present as individual clasts of massive, rather than interstitial, ice and we interpreted it as glacier ice transported by the debris flows (Figure 8). The survival of ice clasts from events in 2016, 2015, or even 2013 is not surprising, given the fact that even just a few inches of debris are enough to insulate the subsurface and dramatically slow ice melt. We know from looking at satellite images, however, that much of the ice that was deposited at the surface of the deposit has since melted. It is very difficult, unfortunately, to estimate the relative proportions of ice and bedrock and sediment transported by each event.
The headwall of the valley is an impressive sight (Figure 9). It is surprising that the area where the ice failed appears to be among the least steep parts of the glacier. The glacier topography does not appear to have been steep enough to generate an ice avalanche, at least in the sense of the term normally used for serac falls originating from steep ice cliffs. This is one of the persistent mysteries of this project: how to characterize and understand the sudden loss of glacier ice. The loss was too sudden to be called a glacier surge (a rapid advance of the glacier tongue, not usually catastrophic); too rapid and kinematic to be compared with more typical climate-driven glacier melt; and it involved too much low-angle ice to be considered an ice avalanche. In fact, parts of the glacier, bizarrely crevassed and folded, are still attached to much steeper cliffs surrounding the portion of the glacier that failed. In contrast, the exposed, post-failure mountainside, presumably the failure plane, only has a slope of about 20 degrees. For safety reasons we did not access the headwall on foot, but instead flew a small, multi-rotor Unmanned Aerial Vehicle (UAV) towards the release zone to record more detail. We found the black mudstone to be heavily folded and fractured, with signs of crumbling rock and ice everywhere. In many areas, ice was mixed with sediment to the point where it was impossible to tell them apart. We found this typically in steep outcrops weeping black debris over lower-angle ice and snow below.
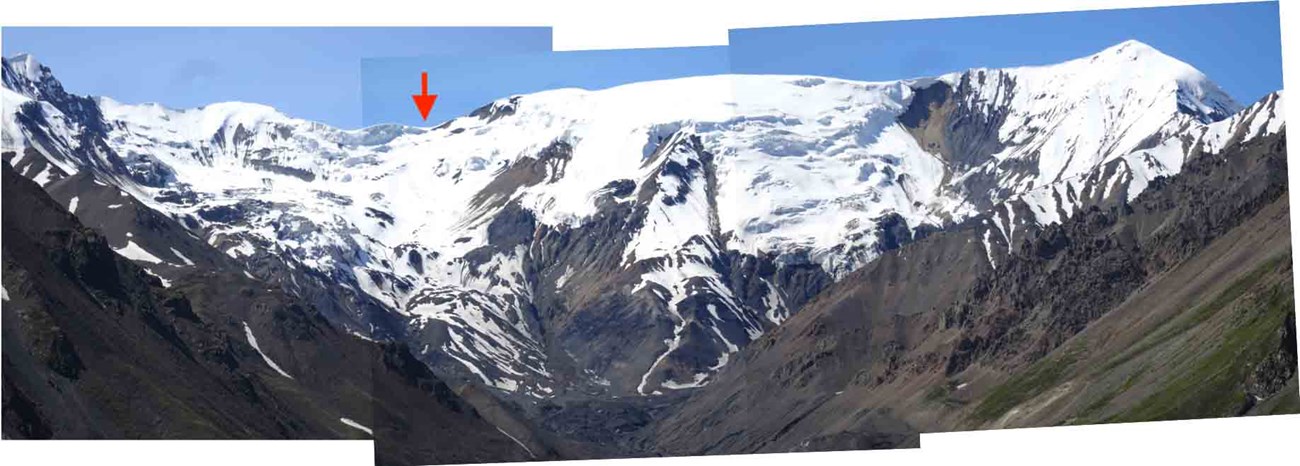
Photo courtesy of Mylène Jacquemart, CU Boulder
A definitive statement about what exactly hap-pened at Flat Creek remains difficult. We can say with confidence that each event involved some variable mix of glacier ice and lithic material, that together formed a wet slurry that flowed downstream at high velocities as something that resembled a debris flow. But how and why did the ice fail? Did the ice collapse precipitate further collapse of adjacent or underlying bedrock? Or did the failures originate in bedrock and incorporate the overlying ice? Finally, where did all the water come from? Flat Creek is a very small stream and ice avalanches rarely (if ever) generate enough water by themselves to sustain a water-rich downstream flow. However, our preliminary analysis of climate data does show that 2013 and 2015 were very warm years, with above-freezing temperatures likely generating significant amounts of meltwater, even at high elevations. Anticipating that another event may yet occur, we left time-lapse cameras in Flat Creek at the end of our 2018 field season.
In the meantime, we are conducting further analyses of meteorological and satellite data; completing lab work on rock, sediment, and tree core samples; and running numerical models of the flow itself. Ultimately, our goals in studying these events are not only to understand the nature of the flows themselves, but to identify the trigger (or triggers) that led to the collapse of Flat Creek Glacier. As mentioned earlier, the type of glacier detachment and runout that apparently occurred here has only a few known precedents worldwide, but those precedents are sobering. In the 2002 Caucasus glacier collapse, over 120 people were killed and an entire village was obliterated. In the 2016 event in Tibet, nine people and hundreds of herd animals were killed. In both cases, the precipitating glacier collapse was later characterized by researchers as extraordinary and outside the normal boundaries of expected glacier behavior. Of course, this is a reflection, at least in part, of our incomplete understanding of glacier and debris-flow dynamics. Does it also mean that the worldwide trend toward accelerated glacier mass loss is accompanied by new and potentially more dangerous forms of retreat? In a national park with over 3,000 individual glaciers and a collective glaciated area of over 11,000 square miles (>29,000 km2; Loso et al. 2014), that question is an urgent one.
References
Brideau, M., D. Stead, C. Hopkinson, M. Demuth, J. Barlow, S. Evans, and K. Delaney. 2008.
Preliminary description and slope stability analyses of the 2008 Little Salmon Lake and 2007 Mt . Steele landslides, Yukon: The Little Salmon Lake landslide reactivation. Yukon Explor. Geol. November: 119-134.
Caplan-Auerbach, J. and C. Huggel. 2007.
Precursory seismicity associated with frequent, large ice avalanches on Iliamna volcano, Alaska, USA. J. Glaciol. 53(180):128-140.
Costa, J. E. 1984.
Physical Geomorphology of Debris Flows, in Developments and Applications of Geomorphology, Springer-Verlag Berlin Heidelberg, pp. 268-317.
Evans, S. G., O. V. Tutubalina, V. N. Drobyshev, S. S. Chernomorets, S. McDougall, D. A. Petrakov, and O. Hungr. 2009.
Catastrophic detachment and high-velocity long-runout flow of Kolka Glacier, Caucasus Mountains, Russia in 2002. Geomorphology 105(3-4): 314-321.
Huggel, C., J. J. Clague, and O. Korup. 2012.
Is climate change responsible for changing landslide activity in high mountains? Earth Surf. Process. Landforms 37(1): 77-91.
T. Jorgenson, K. Yoshikawa, M. Kanevskiy, Y. Shur, V. Romanovsky, S. Marchenko, and G. Grosse. 2008.
Permafrost Characteristics of Alaska. Proc. Ninth Int. Conf. Permafr. 29:121-122.
Kääb, A., S. Leinss, A. Gilbert, Y. Bühler, S. Gascoin, S. G. Evans, P. Bartelt, E. Berthier, F. Brun, W. A. Chao, D. Farinotti, F. Gimbert, W. Guo, C. Huggel, J. S. Kargel, G. J. Leonard, L. Tian, D. Treichler, and T. Yao. 2018.
Massive collapse of two glaciers in western Tibet in 2016 after surge-like instability. Nat. Geosci. 11(2):114-120.
Loso, M. G., A. Arendt, C. Larsen, J. Rich, and N. Murphy. 2014.
Alaskan national park glaciers – status and trends: Final report. National Resource Technical Report NPS/AKRO/NRTR—2014/922. National Park Service, Fort Collins, Colorado.
McPhee, J. 1988.
Los Angeles against the Mountains. The New Yorker, September 26 issue. Available at: https://www.newyorker.com/magazine/1988/09/26/los-angeles-against-the-mountains-i (accessed 2019-05-04)
J. P. Milana. 2016.
Molards and their relation to landslides involving permafrost failure. Permafr. Periglac. Process. 27(3): 271–284.
Planet Team. 2017.
Planet Application Program Interface: In Space for Life on Earth. San Francisco, CA. Available at: https://api.planet.com (accessed 2018-09-02)
Last updated: December 30, 2019
