Thank you to all of our volunteers who participated in the 2016 downstream migrant trapping surveys on Olema and Redwood Creeks. Through your dedication and flexibility, we were able to successfully run traps at three locations throughout the spring.
Trapping Season Highlights
Happening Now!
Although our smolt trapping season has come to a close, summer monitoring is underway. Summer monitoring will provide coho and steelhead population abundance and distribution data for Olema, Pine Gulch, and Redwood Creeks. To obtain this information we use a combination of snorkeling and electrofishing surveys that will continue through September. Snorkeling and electrofishing provide excellent opportunities to monitor and observe a wide variety of aquatic species including coho salmon, steelhead trout, stickleback, sculpin, and salamanders.
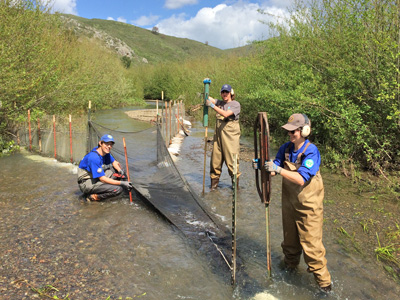
The 2016 trapping season began in late March. Two traps were constructed on Redwood Creek and one trap was constructed on Olema Creek. One of the Redwood Creek traps was a backwater trap constructed in addition to our normal mainstem trap to assess salmonid utilization of this creek feature during the late winter/early spring months. The mainstem trap was installed just upstream of the backwater trap and was used to estimate the total number of coho smolts leaving Redwood Creek. Together, the traps will assist in assessing the success of recent restoration work, as well as help monitor Redwood Creek’s annual coho smolt outmigration. The Olema Creek trap was placed approximately 1.5 km upstream of the confluence with Lagunitas Creek and downstream of the town of Olema. Like the mainstem Redwood Creek trap, it was used to assess coho smolt outmigration.
The mainstem Redwood Creek trap was in operation for 61 days and captured a total of 483 coho smolts, starting with a coho smolt caught on March 29th. The backwater Redwood Creek trap was in operation for 46 days and captured one coho fry on April 10th. The Olema Creek trap was in operation for 62 days and captured a total of 421 coho smolts, beginning with the first coho smolt captured on March 30th.
Results

Michael Reichmuth / NPS
The peak of outmigration on Olema Creek was observed during the fifth week of trapping (April 19–April 25) when a total of 150 coho smolts were caught. Peak outmigration also occurred during the fifth week of trapping on the Redwood Creek mainstem, with a total of 167 coho smolts captured. This is a week earlier than historical peak trapping data from previous years for both creeks. Other fish species captured this season included lamprey ammocoetes, California roach, stickleback, sculpin, Sacramento suckers, and golden shiners.
The average fork length of coho smolts captured in Olema Creek was 118 mm, and the average fork length of steelhead smolts was 160 mm. On the Redwood Creek mainstem, the average coho smolt length was 122 mm, and the average steelhead smolt fork length was 180 mm. The average coho fork length for 2016 was larger than the historical average (third highest average fork length for both creeks) on both Olema and Redwood Creeks. Likewise, the average steelhead smolt fork length was higher than the historical average for both creeks (slightly higher for Olema Creek steelhead smolts, and the highest on record for Redwood Creek steelhead smolts).
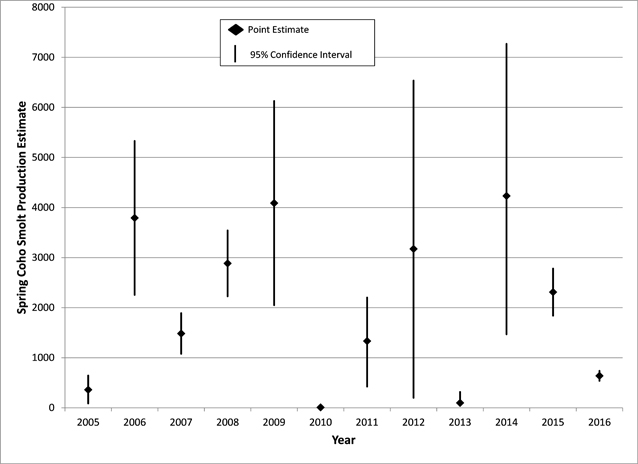
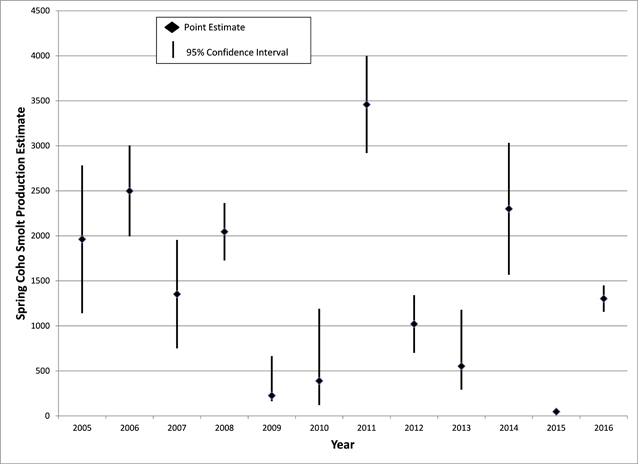
Figures 1 & 2 present coho smolt production estimates, or the estimated total number of smolts emigrating to saltwater, for each monitored watershed. The preliminary 2016 coho smolt production estimate for Olema Creek is 639 fish (SE 101). The preliminary 2016 coho smolt production estimate for Redwood Creek is 1,303 fish (SE 147). Both estimates represent increases in smolt production when compared with estimates from 2013 when this cohort was last seen.


PIT Tag Results
For the eighth consecutive trapping season, passive integrated transponders (PIT tags) were used to tag a portion of the captured coho and steelhead smolts. These tags provide us with a variety of useful data. For example, during the smolt trapping season, they are used to gauge the efficiency of the mainstem traps, and to calculate production estimates for each watershed.
These same PIT tagged fish can turn up in the course of future monitoring efforts as well. For instance, coho smolts tagged during the 2016 trapping season can be detected again when they return as adults during the winter of 2017-2018. Such recapture information can then be used to increase the accuracy of adult return estimates and improve our understanding of the factors that affect smolt survival in the ocean.
On Olema Creek, 202 coho smolts were PIT tagged, while 195 coho smolts were tagged from Redwood Creek. Fifteen juvenile coho that were tagged in the summer of 2015 on Olema Creek were recaptured during smolt trapping operations in the spring of 2016. On average, the recaptured fish showed an increase of 40 mm in length and 11.0 g in weight (see Table 1.). On Redwood Creek, 13 smolts were captured that had been tagged during the summer of 2015. These recaptured fish showed an increase of 53 mm and 16.7 g (Table 1).
|
Table 1. Observed average weight and fork length gain in coho juveniles tagged during the summer surveys and later recaptured during spring smolt surveys. |
|||||
|
Creek |
Year |
Number of PIT tagged coho recaptured |
Average weight increase(summer to spring) |
Average fork length increase (summer to spring) |
|
|
Redwood |
2010 |
4 |
10.5 g |
40 mm |
|
|
Redwood |
2011 |
52 |
9.4 g |
34 mm |
|
|
Redwood |
2012 |
2 |
14.4 g |
48 mm |
|
|
Redwood |
2013 |
7 |
10.9 g |
39 mm |
|
|
Redwood |
2014 |
20 |
11.8 g |
44 mm |
|
|
Redwood |
2015 |
1 |
0 g |
7 mm |
|
|
Redwood |
2016 |
13 |
16.7 g |
53 mm |
|
|
|
|
|
|
|
|
|
Olema |
2011 |
3 |
8.1 g |
35 mm |
|
|
Olema |
2012 |
3 |
11.2 g |
38 mm |
|
|
Olema |
2013 |
0 |
NA |
NA |
|
|
Olema |
2014 |
10 |
10.2 g |
43 mm |
|
|
Olema |
2015 |
5 |
8.8 g |
41 mm |
|
|
Olema |
2016 |
15 |
11.0 g |
40 mm |
|
For More Information
Contact Michael Reichmuth at michael_reichmuth@nps.gov or call 415-464-5191.
The National Park Service shall not be held liable for improper or incorrect use of the data described and/or contained herein. These data and related graphics (if available) are not legal documents and are not intended to be used as such. The information contained in these data is dynamic and may change over time. The National Park Service gives no warranty, expressed or implied, as to the accuracy, reliability, or completeness of these data.

Last updated: September 20, 2016
