Last updated: October 27, 2022
Article
Grand Canyon webcam records plant phenology that contradicts satellites

Jodi Norris
NPS and USGS scientists found that a commonly used method of measuring vegetation greenness from satellites does not work properly in many western US ecosystems, including most western pinyon-juniper woodlands and many conifer forests and woodlands.
Why use satellites to monitor vegetation?
Scientists with the Southern Colorado Plateau Network (SCPN) use satellite imagery to measure vegetation greenness in network parks. We do this because tracking the amount and timing of greenup of plants (plant phenology) can tell us how healthy the vegetation is in the park and can quickly alert us to unexpected changes. Satellites are well suited for this kind of monitoring because they take photos while circling continuously, high above the Earth. Thus, they provide a landscape-scale picture that is repeated over time. Satellite imagery has been used to monitor vegetation for nearly 50 years. NDVI is a commonly used index to estimate greenness from satellite or ground-based imagery.

SCPN
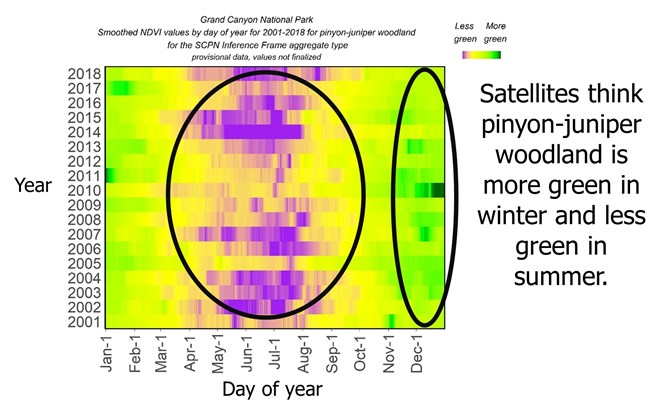
Scientists were surprised when the imagery showed that the pinyon-juniper ecosystem in Grand Canyon National Park (NP) got greener (as measured by NDVI) in winter than at any other time of year (Figure 1).This implied a surge of plant growth during winter. The same pattern was found across pinyon-juniper ecosystems in other network parks. This contradicted what we know about pinyon phenology in cold winter climates. On the other hand, we know little about seasonal growth patterns in juniper species; could it be that they actually do get greener in the winter?
Will a phenocam corroborate the satellite data?
The graph of seasonal greenness in Figure 1 shows the winter peak in the phenology for the pinyon-juniper ecosystem in Grand Canyon NP generated from the satellite NDVI data (MODIS sensor data were collected by the Aqua and Terra satellites). To test whether vegetation was really getting greener in the winter, SCPN scientist Jodi Norris teamed up with USGS scientist Jessica Walker. Walker had also observed surprising winter or late-fall NDVI peaks in Arizona woodlands. With help from the Phenocam Network, the SCPN and USGS installed a phenocam in the pinyon-juniper ecosystem of Grand Canyon NP to see what was really happening there throughout the year. A “phenocam” is a digital camera set up at a fixed location to capture plant phenology through time-lapse images. The field of view for the phenocam is shown in Figure 2.

SCPN
Labels in Figure 2 correspond to the NDVI curve labels in Figure 3. Junipers are outlined in red and labelled A, B, and C. Pinyon trees are outlined in blue and labelled D and E. Other species are outlined in yellow and labelled F, G, H, and I. A composite ecosystem area comprises the field of view beneath the approximate horizon line labelled 'J'. A sky condition indicator area is outlined in gray.
The phenocam showed that the none of the main species in the ecosystem got greener in the winter (Figure 3). This meant that the winter NDVI peaks seen in the satellite data in Figure 1 were likely to be false peaks that were not a result of actual vegetation growth during winter. Further, the phenocam provided a clue as to the reason these peaks may have occurred—scientists observed that when a plant was shaded by another plant, its phenocam NDVI jumped higher suddenly, only to drop back down at other times of day when the plant was not shaded.

SCPN
Letter designations in Figure 3 correspond to polygon labels in Figure 2. Only data from the phenocam images that corresponded to the times when the Aqua and Terra satellite flyovers occurred are included here. We also removed cloudy photos. Black ovals indicate times when the target vegetation polygon was shaded. Gray ovals indicate times when the background of the target vegetation polygon was shaded. [nerd note: To understand why there are NDVI results with negative values, check out Norris and Walker 2020].
View current phenocam image.
Teasing apart the satellite data patterns
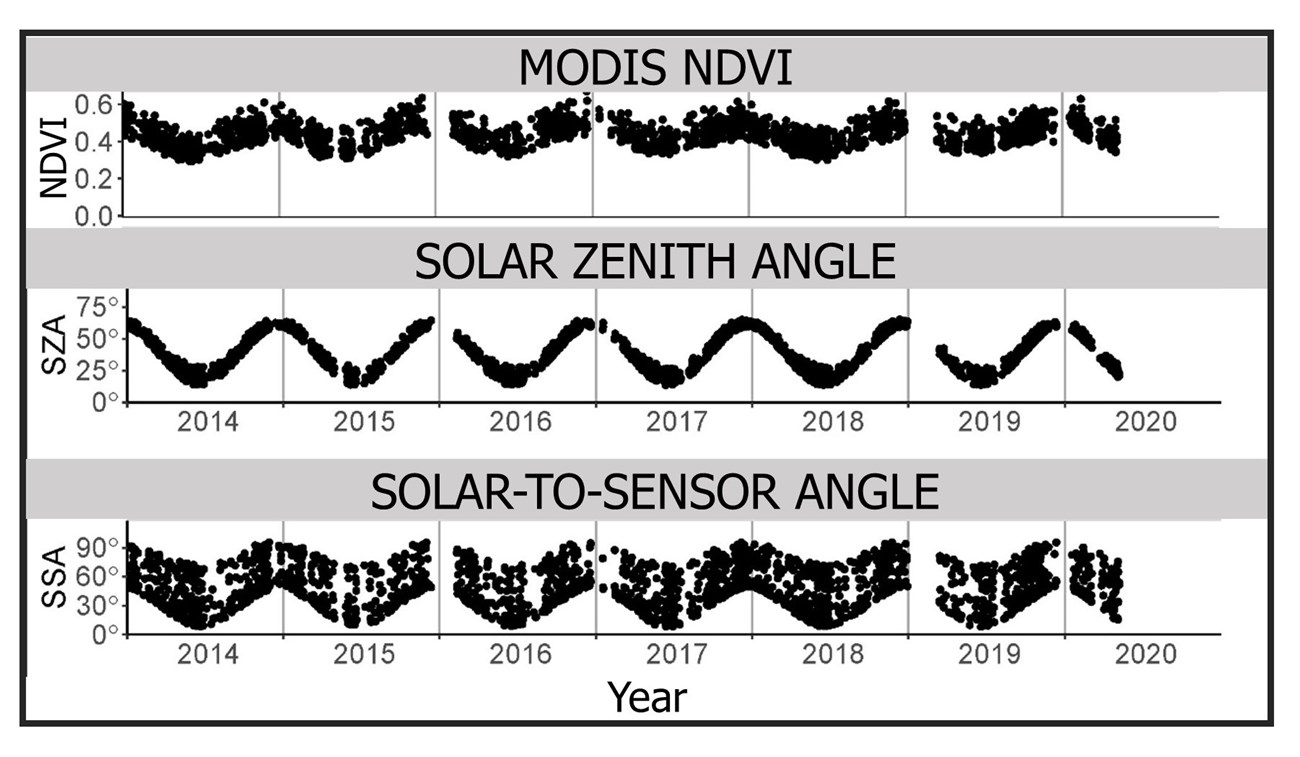
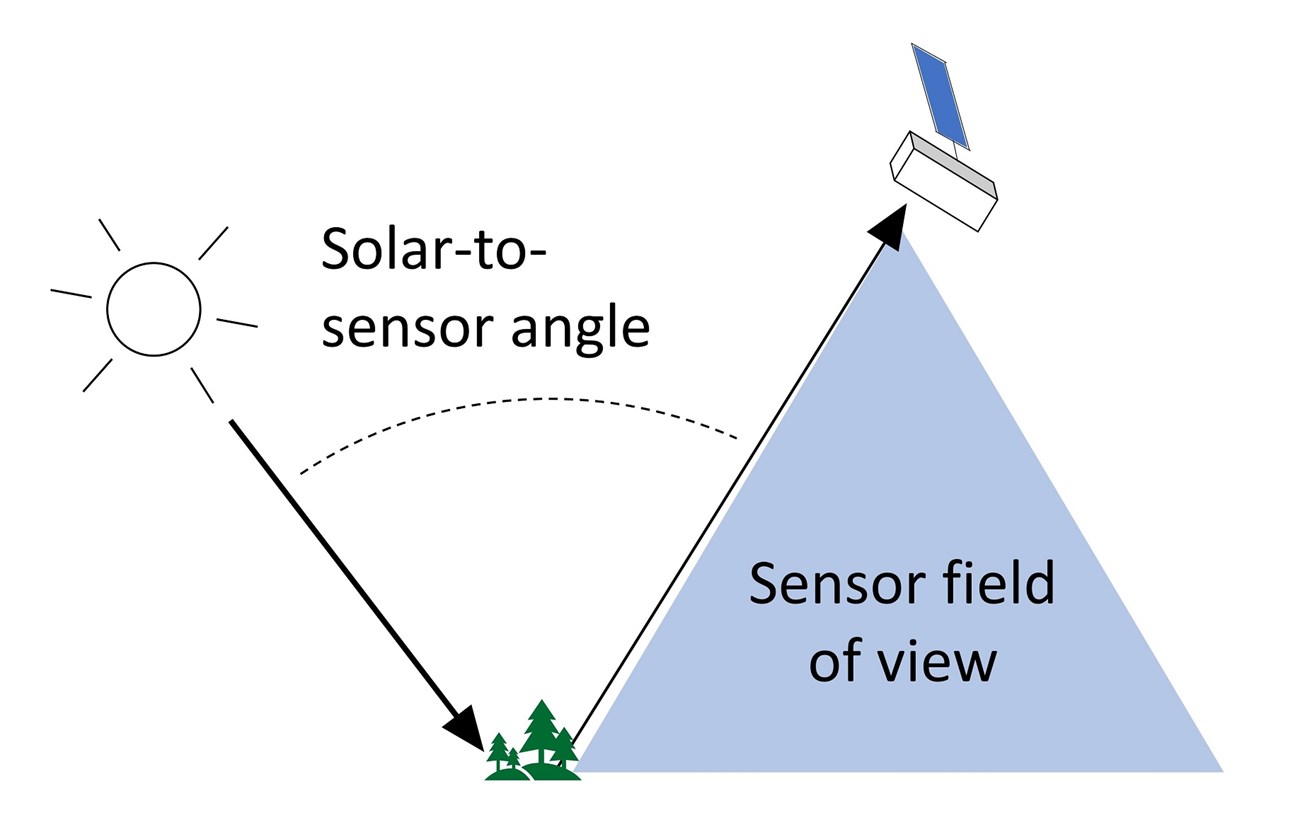
Norris and Walker went back to the satellite data to see if they could discover the cause of the false reading of greenness in Grand Canyon NP. They looked at the angles that could affect NDVI and found that the satellite NDVI was responding to the relative positions of the sun and the sensor in the sky at the time that each measurement was collected (Figure 4). In particular, most of the annual variability in NDVI could be predicted by looking at the angle between the sun and the satellite sensor (the 'solar-to-sensor angle', Figure 5).

SCPN
In the top graph of Figure 4, the patterns of satellite-NDVI in Grand Canyon pinyon-juniper woodland through the years show both high day-to-day variability and seasonal winter peaks. In the middle graph, patterns of solar zenith angle from the MODIS satellite show its potential as a seasonal driver. In the bottom graph, patterns of solar-to-sensor angle show both the seasonal effects caused by solar zenith angle as well as high day-to-day variability caused by the wide swath of the MODIS satellite.

SCPN
Figure 5 shows an example of the solar-to-sensor angle and a shaded area showing the large sensor field of view. In winter, the sun is lower in the sky, leading to a large solar-to-sensor angle (and longer shadows that might shade vegetation). In general, the increases in solar-to-sensor angle seen in winter, are consistent with the corresponding increases in NDVI in these areas where winters are cold.
Furthermore, when they looked at the plot of NDVI to solar-to-sensor angle, not only did they see that NDVI increased with increasing solar-to-sensor angle, they also noticed that there appeared to be two sets of data that behaved independently (Figure 6). They determined that this was caused by whether the sensor was being struck by reflectance in a forward direction, or from a backward direction (Figure 7).

SCPN
Figure 6 shows the relationship of satellite NDVI with solar and sensor geometry for the Grand Canyon phenocam location in 2018, the year for which there is corresponding phenocam data. [nerd note: correlation between things doesn't by itself mean that one causes the other. To find out how the scientists singled out the geometry between the sun and the satellite as the cause, see Norris and Walker 2020.]

SCPN
Why does solar-to-sensor angle affect satellite NDVI?
We aren't certain, but the most likely reason solar-to-sensor angle affects NDVI is because the shadows are longer when the sun angle is low (for example, in the winter), and the satellite sensor is still high in the sky. Previously, scientists tested how shadows affected NDVI, and they found that that NDVI increases as the shadowed area increases. It appears that the increase in NDVI due to shadowing can overwhelm the relatively small annual changes in greenness that occur each year in an evergreen system like pinyon-juniper woodlands.
What other ecosystems are affected?
If shadowing causes false winter peaks, then we would expect other ecosystems that have longer shadows in winter to experience this effect also. To explore this hypothesis, Walker and Norris looked at where winter NDVI peaks occurred in the western United States. As a precaution, they restricted their analysis to areas that had cold (subfreezing) winters, because it is possible that true winter green-up occurs in areas with mild winter temperatures. For the 16-year period 2003–2018, they found many places in the western United States that had frequent winter peaks (at least 5 of the 16 years). Many places had winter NDVI peaks nearly every year (Figure 8).

SCPN
As one might expect, pinyon-juniper ecosystems consistently had these false winter peaks, but so did many other ecosystems, including many areas of ponderosa forest and woodland in the SCPN. Figure 9 shows a map of the four most widely affected ecosystem types based on LANDFIRE physiognomic classification maps. This map probably underestimates the problem, because we only looked at places where the problem was so large that it completely shifted the timing of the NDVI peak to another season. In general, the ecosystems most likely to show satellite-derived NDVI peaks in winter have sparse, tall, evergreen vegetation, which casts long shadows in the winter and lacks the dramatic seasonal changes in greenness seen in areas with deciduous plants.

SCPN
Why hadn't this been noticed before?
It turns out that over the last 30 years, many scientists had noticed problems with NDVI and shadows and the varying geometry of the sun’s position though the day and through the seasons. A few scientists even noticed the winter-peaking pattern in pinyon-juniper and commented on it. However, only a few studies, on different continents, made the leap from identifying problems with solar and sensor geometry and NDVI to identifying where those problems occurred, and therefore where NDVI may be an inappropriate tool.
A related problem occurs in ecosystems with winter snow. The snow lowers NDVI, which can mask the appearance of winter NDVI peaks. Any snow within the field of view will cause the satellite NDVI to drop dramatically.Where do we go from here?
We are left with a question: what satellite tools can we use to measure greenness in these ecosystems? Norris and Walker found the same problem with NDVI derived from four other satellites as well, so switching satellites doesn't help. Identifying a solution begins with testing alternatives to NDVI against confirmed ground-based phenology data, such as data from the Phenocam Network or the National Phenology Network. For now, we do not have a solution, so SCPN is not using satellite-based NDVI to measure greenness in pinyon-juniper or ponderosa ecosystems. Luckily, satellite-based NDVI is still a useful tool in other SCPN ecosystems.
The information in this brief was summarized by Jodi Norris and Jean Palumbo from the following journal article:
