Last updated: September 19, 2022
Article
Climate and Water Monitoring at Saguaro National Park, Water Year 2019
Overview
Climate and hydrology are major drivers of ecosystems. They dramatically shape ecosystem structure and function, particularly in arid and semi-arid ecosystems. Understanding changes in climate, groundwater, and water quality and quantity is central to assessing the condition of park biota.
At Saguaro National Park, scientists from the Sonoran Desert Network help park managers know what kind of change is happening by taking the same measurements of key resources year after year, much as a doctor keeps track of a patient’s vital signs. This long-term ecological monitoring provides early warning of potential problems, giving managers time to figure out how to mitigate them before they become worse. At Saguaro, that monitoring includes climate, weather, groundwater, and springs, among other “vital signs.”
Water conditions are closely related to climate conditions. Because the two are better understood together, the Sonoran Desert Network reports on climate in conjunction with water resources. Reporting is done by water year (WY), which begins in October and ends the following September. This article provides an integrated look at climate, groundwater, and springs conditions at Saguaro National Park (NP) during water year 2019 (October 2018–September 2019).
Climate and Weather
Background
There is often confusion over the terms “weather” and “climate.” In short, “weather” describes instantaneous meteorological conditions, such as whether it’s currently raining or snowing, or a hot or frigid day. “Climate” reflects patterns of weather at a given place over long periods of time (seasons to years). Climate is the primary driver of ecological processes on earth. Climate and weather information provide a basis for understanding what we see happening in other park vital signs.
An aridity index can be useful for contrasting the climate of national parks and help answer the question, “How dry is dry?” Used globally to classify climate zones, aridity indices are used to compare long-term average annual precipitation relative to the average annual potential evapotranspiration. The climate of Saguaro NP’s lower elevations is classified as arid.
Methods
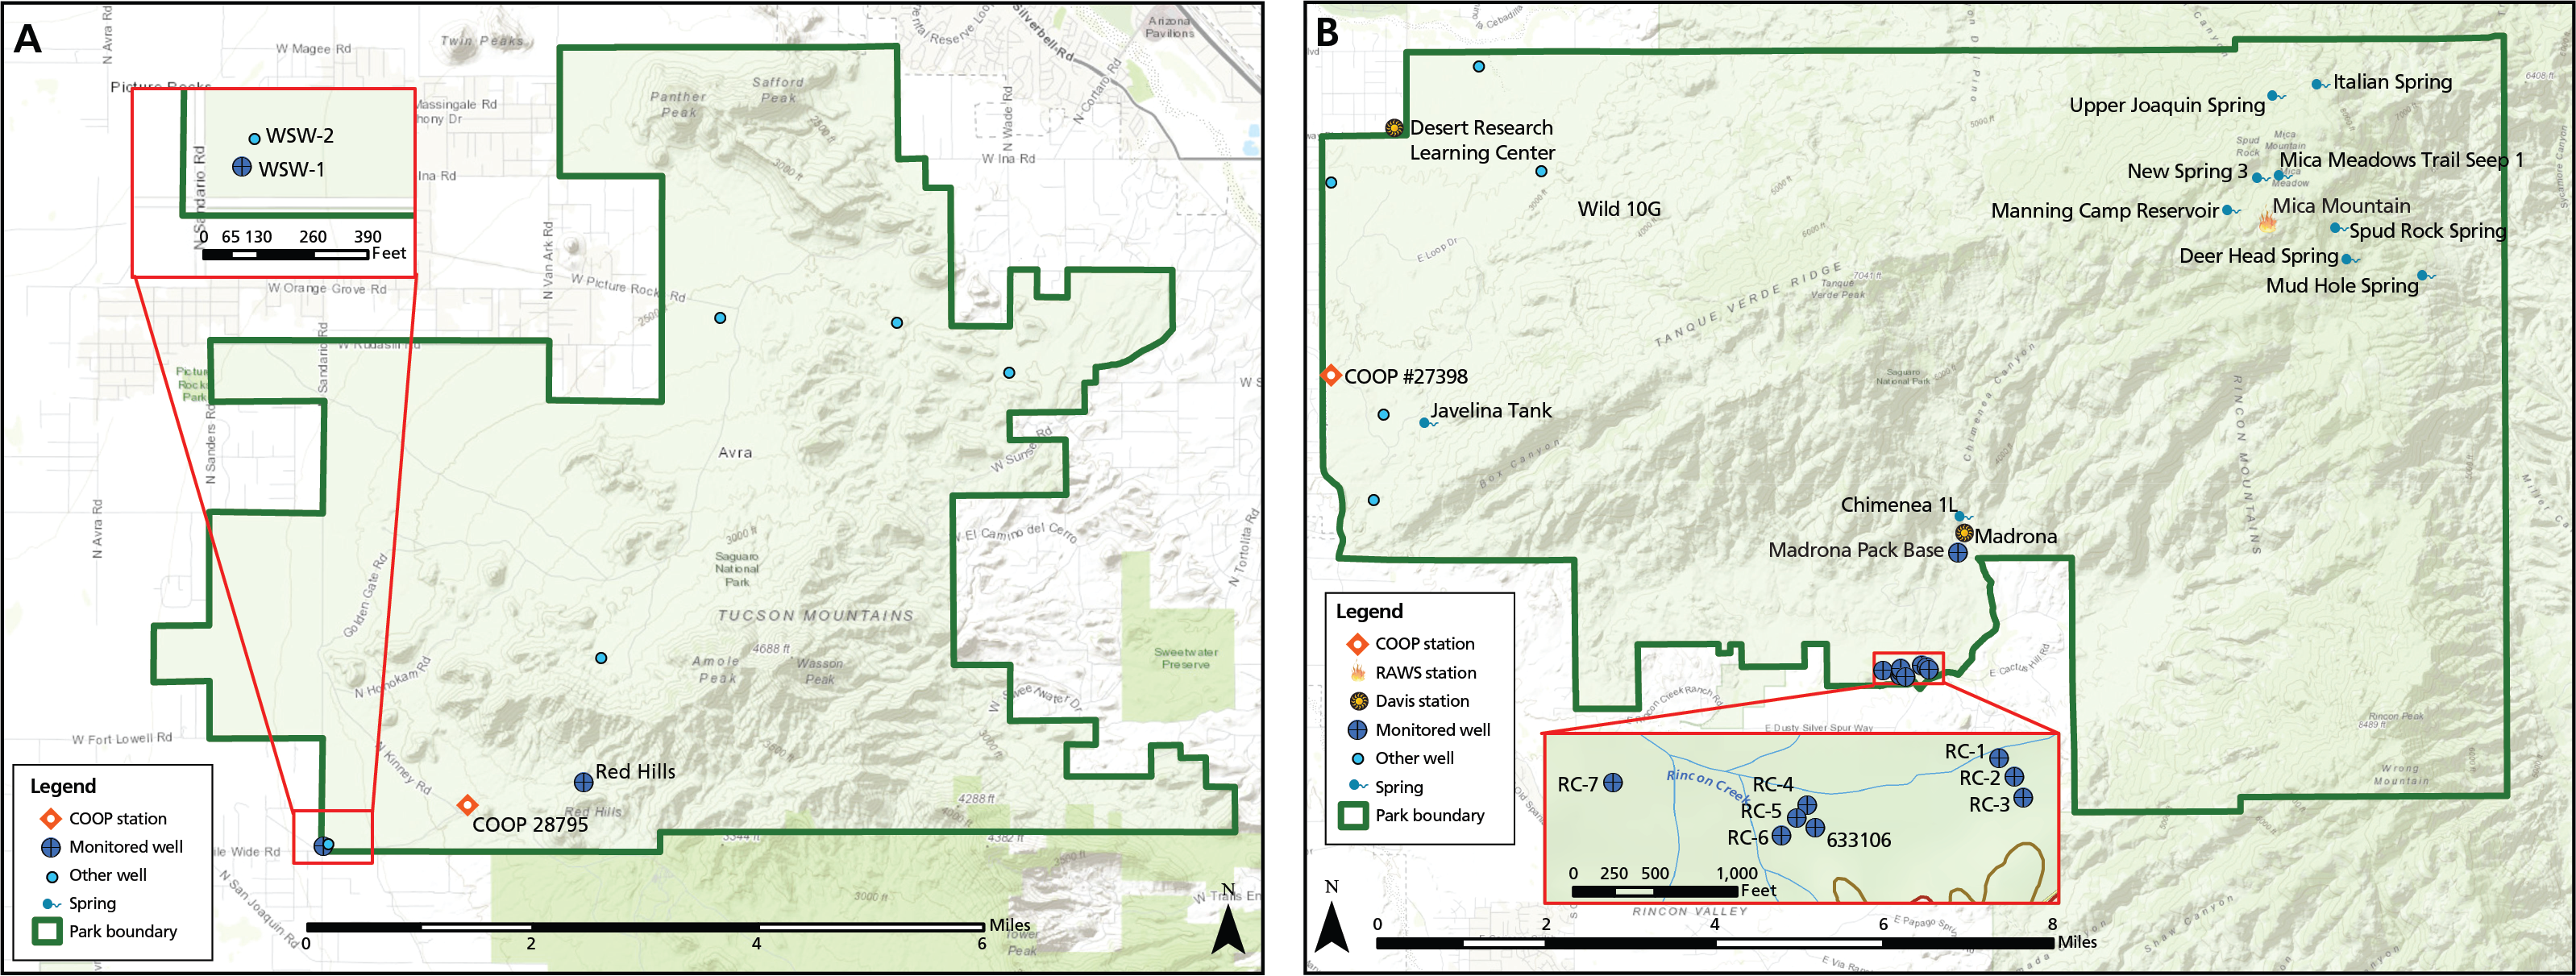
Saguaro National Park has five weather stations: one in the Tucson Mountain District (TMD) and four in the Rincon Mountain District (RMD). The park has two National Oceanic and Atmospheric Administration (NOAA) Cooperative Observer Program (COOP) weather stations (one in each district). The RMD also contains a Remote Automated Weather Station (RAWS) and two Davis weather stations installed by the Sonoran Desert Network (SODN). Data from the RMD COOP station were obtained from NOAA’s Applied Climate Information System. Data from the other stations were obtained from the Climate Analyzer.
Click graphics to enlarge
Recent findings (Water Year 2019)
Annual rainfall in the Rincon Mountain District was 27.36" (69.49 cm) at the Mica Mountain RAWS station and 12.89" (32.74 cm) at the Desert Research Learning Center Davis station. February was the wettest month, accounting for nearly one-quarter of the annual rainfall at both stations.
Each station recorded extreme precipitation events (>1") on three days. Mean monthly maximum and minimum air temperatures were 25.6°F (-3.6°C) and 78.1°F (25.6°C), respectively, at the Mica Mountain station, and 37.7°F (3.2°C) and 102.3°F (39.1°C), respectively, at the Desert Research Learning Center station.
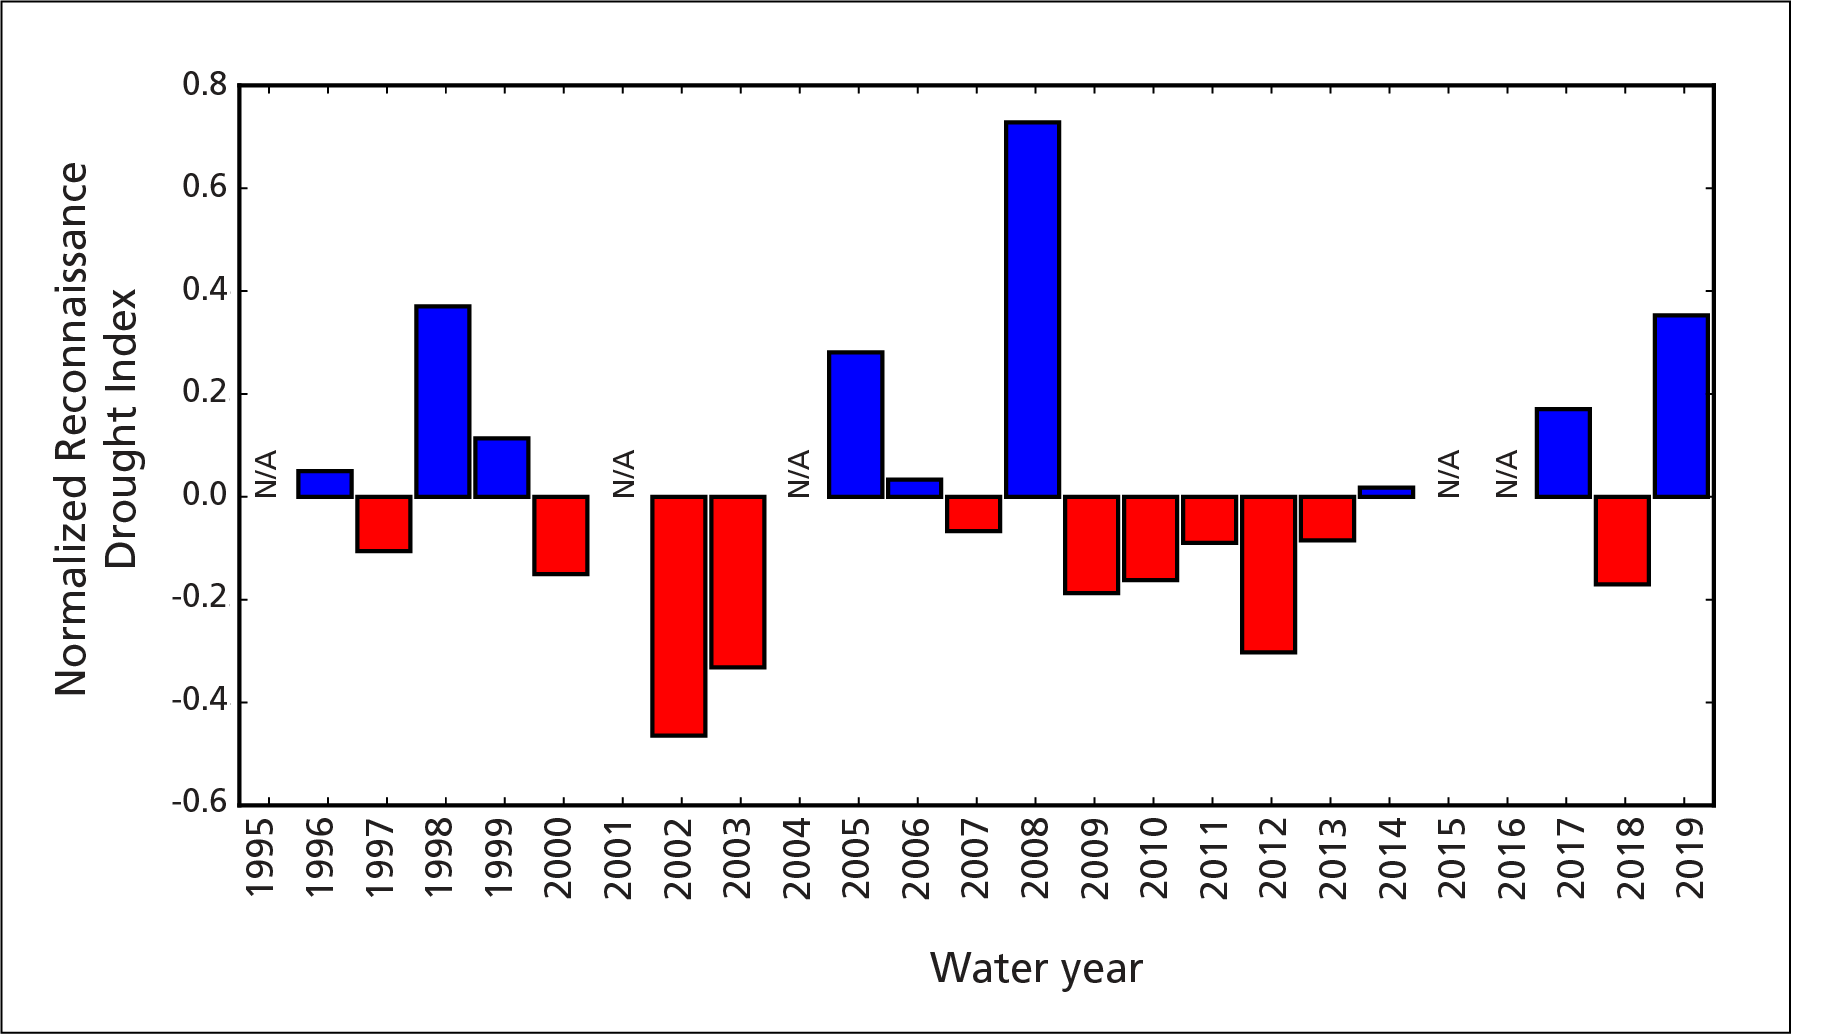
Overall, temperatures in WY2019 were cooler than the mean for the entire record. The reconnaissance drought index for the Mica Mountain station indicated wetter conditions than average in WY2019. Both of the park’s NOAA COOP stations (one in each district) had large data gaps, partially due to the 35-day federal government shutdown in December and January. For this reason, climate conditions for the Tucson Mountain District are not reported.
Groundwater
Background
Groundwater is one of the most critical natural resources of the American Southwest. It provides drinking water, irrigates crops, and sustains rivers, streams, and springs throughout the region. Groundwater is closely linked to long-term precipitation and surface waters, as ephemeral flows sink below ground to reappear months, years, or even centuries later as perennial and intermittent streams and springs. Groundwater also sustains vegetation and is the primary source of water for almost all humans in the southwestern U.S. Groundwater therefore interacts either directly or indirectly with all key ecosystem features of the arid Sonoran Desert ecoregion.
Methods
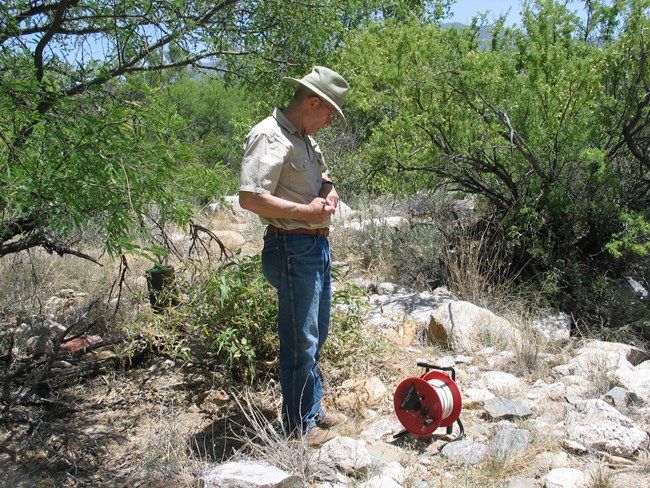
Groundwater is regularly monitored at two wells in the Tucson Mountain District and six wells in the Rincon Mountain District. A combination of automated and manual measurements are used.
Recent findings (Water Year 2019)
The mean groundwater level at well WSW-1 in WY2019 was higher than the mean for WY2018. The water level has generally been increasing since 2005, reflecting the continued aquifer recovery since the Central Avra Valley Storage and Recovery Project came online, recharging Central Arizona Project water.
Water levels at the Red Hills well generally declined starting in fall WY2019, continuing through spring. Monsoon storms led to rapid water level increases. Peak water level occurred on September 18.
The Madrona Pack Base well water level in WY2019 remained above 10 feet (3.05 m) below measuring point (bmp) in the fall and winter, followed by a steep decline starting in May and continuing until the end of September, when the water level rebounded following a three-day rain event. The highest water level was recorded on February 15.
Median water levels in the wells in the middle reach of Rincon Creek in WY2019 were higher than the medians for WY2018 (+0.18–0.68 ft/0.05–0.21 m), but still generally lower than 6.6 feet (2 m) bgs, the mean depth-to-water required to sustain juvenile cottonwood and willow trees. RC-7 was dry in June–September, and RC-4 was dry in only September. RC-5, RC-6 and Well 633106 did not go dry, and varied approximately 3–4 feet (1 m).
| Well | District | Measurement expression | Depth-to-water (ft bgs)A | Water-level elevation (ft amsl)B | Highest water level (ft bgs) | Lowerst water level (ft bgs) | Elevation difference from WY2018 (+/- ft) |
|---|---|---|---|---|---|---|---|
| WSW-1 | TMD | Mean | 319.81 | 2,016.19 | 316.57 | 327.16 | +5.69 |
| Red Hills | TMD | Mean | 8.51 | 2,786.49 | 3.43 | 12.09 | +5.75 |
| Madrona Pack Base | RMD | Mean | 9.48C | 3,357.72 | 1.86C | 26.55C | n/aD |
| RC-4 | RMD | Median | 6.56 | 3,144.45 | 5.20 | >8.83 | +.018 |
| RC-5 | RMD | Median | 8.77 | 3,144.37 | 7.28 | 11.04 | +0.65 |
| RC-6 | RMD | Median | 9.87 | 3,143.90 | 8.23 | 12.14 | +.068 |
| RC-7 | RMD | Median | 8.42 | 3,136.48 | 6.87 | >8.98E | +0.32 |
| 633106 | RMD | Median | 8.24 | 3,145.36 | 6.86 | 9.82 | +0.59 |
Springs
Background
Springs, seeps, and tinajas are small, relatively rare biodiversity hotspots in arid lands. They are the primary connection between groundwater and surface water, and are important water sources for park plants and animals. For springs, the most important questions we ask are about persistence (How long was there water in the spring?), and water quantity (How much water was in the spring?).
Climate change is an emerging impact on springs in the American Southwest. Anticipated changes include increased air temperatures, evaporation rates, and drought intensity; more frequent and extreme rainfall and heat events; and potentially reduced precipitation in the winter and spring. These changes may cause springs to experience reduced flow or even go dry, which may disrupt ecological functions, reduce species diversity, and negatively impact visitor experience.
Methods
The Sonoran Desert Network monitors a suite of vital signs and parameters organized into four modules: site characterization, site condition, water quantity, and water quality. Data for the site-condition, water-quantity, and water-quality modules are collected annually, except for the persistence parameter (within the water-quantity module). Data on this parameter span the entire water year when possible. Data for the site-characterization module are collected every five years.
Recent findings (Water Year 2019)
Eleven springs were monitored in the Rincon Mountain District in WY2019. Most springs had relatively few indications of anthropogenic or natural disturbance. Anthropogenic disturbance included spring boxes or other modifications to flow. Examples of natural disturbance included game trails and scat. In addition, several sites exhibited slight disturbance from fires (e.g., burned woody debris and adjacent fire-scarred trees) and evidence of high-flow events.
Crews observed 1–7 taxa of facultative/obligate wetland plants and 0–3 invasive non-native species at each spring. Across the springs, crews observed four non-native plant species: rose natal grass (Melinis repens), Kentucky bluegrass (Poa pratensis), crimson fountaingrass (Cenchrus setaceus), and red brome (Bromus rubens).
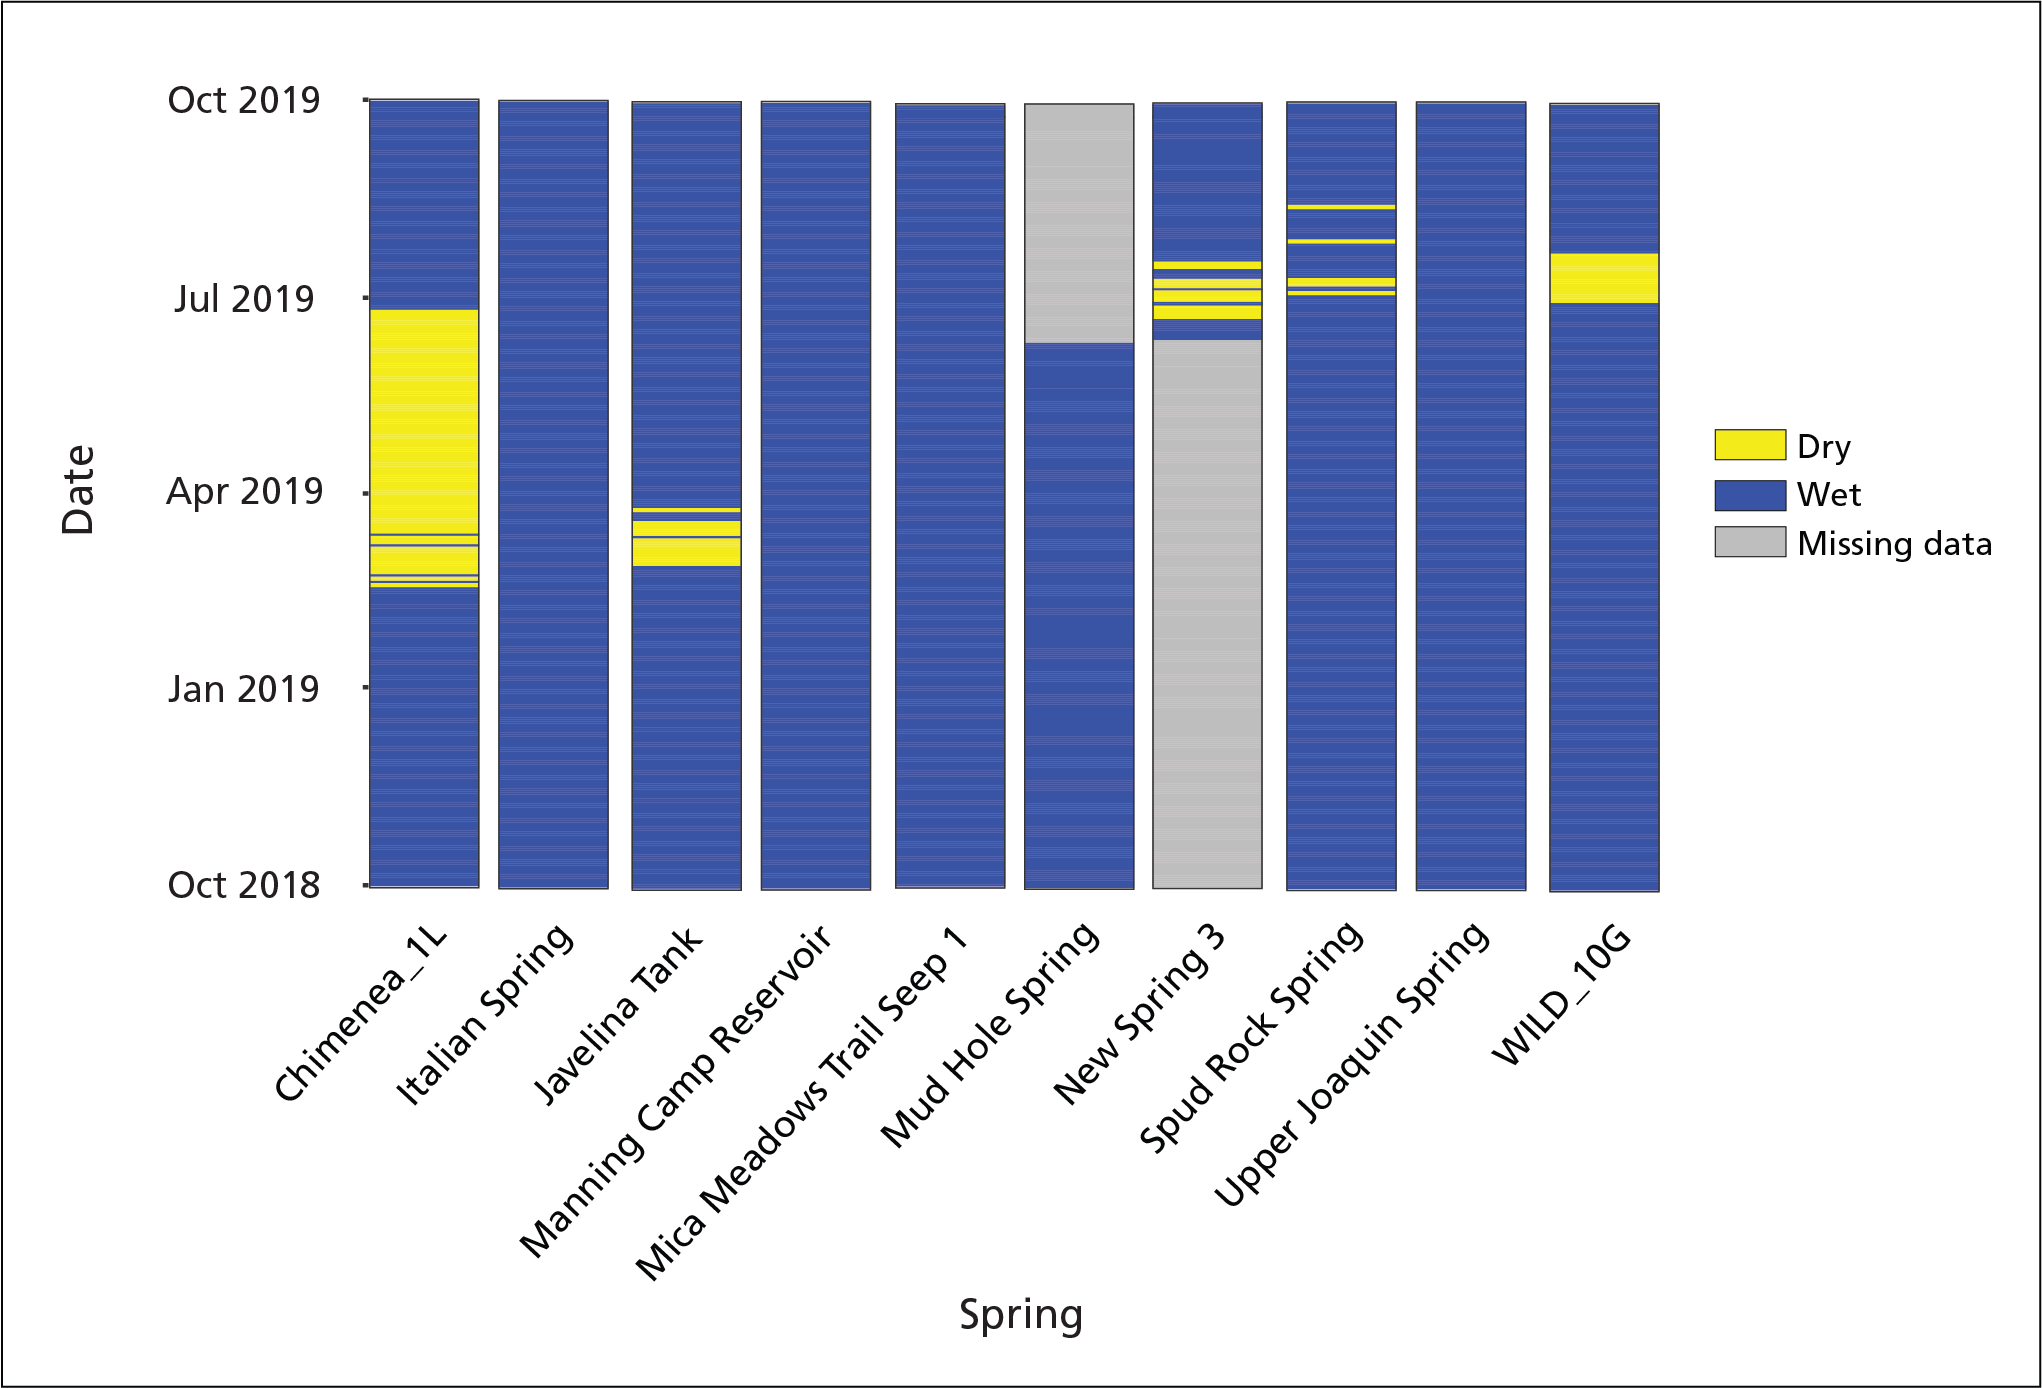
It is likely that that all springs had surface water for at least some part of WY2019 (see figure below). However, temperature sensors to estimate surface water persistence failed at one site and were not deployed at two others for all or part of the water year. Water was present for most of the year at the other eight sites. For the four sites with measurable discharge during the WY2019 visit, two sites had flow rates below 1 L/minute, one site had flow of ~5 L/minute; and one site had flow of ~14 L/minute. Baseline data on water quality and chemistry were collected at all springs.
Information in this article was summarized from Status of Climate and Water Resources at Saguaro National Park: Water Year 2019, by K. Raymond, L. Palacios, J. A. Hubbard, C. L. McIntyre, and E. L. Gwilliam, in press.
