Last updated: May 16, 2023
Article
Bird Population Trends in the Sierra Nevada Network, 2011-2019

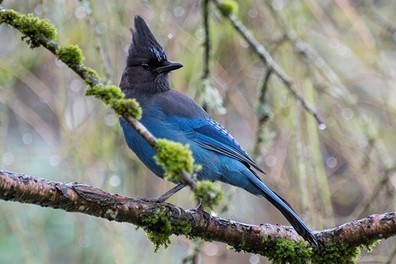
Bryan Jones, Flickr, CC-BY-NC-ND 2.0.
Why monitor birds?
Birds occur across elevations and represent more than 60 percent of vertebrate species in these parks. They are good indicators of change in terrestrial ecosystems and occupy a prominent position in most food webs. As climate changes, increased temperature, decreased snowpack, altered fire regimes, and plant community shifts may alter the ranges of bird species.
Data documenting bird population changes contribute to park planning documents and can support assessments of bird population vulnerability to large-scale change such as warming temperatures and increasing severity of drought and wildfires. After nearly a decade of monitoring bird populations in Sierra Nevada Network parks with our partners at The Institute for Bird Populations (IBP), we have our first report of trends in bird abundance, based on data collected between 2011 and 2019.
When, where, and how do we monitor birds?
During May through July (bird breeding season), field crews capture information on bird distribution and abundance, conducting point counts along mile-long, off-trail transects randomly located near the trail systems in Sequoia and Kings Canyon National Parks (SEKI) and Yosemite National Park (YOSE) (Figure 1). At the much smaller Devils Postpile National Monument (DEPO), a grid of points is monitored each year. At regular points along these transects or in the DEPO grid, the birders document every bird seen or heard within a 7-minute time frame. They also record information about the habitat at each point count location.
Monitoring objectives are to:
- Detect trends in the density of bird species that are monitored well by point counts, in accessible areas during the breeding season.
- Track changes in breeding-season distribution of bird species throughout accessible areas of the parks.

NPS / Sylvia Haultain
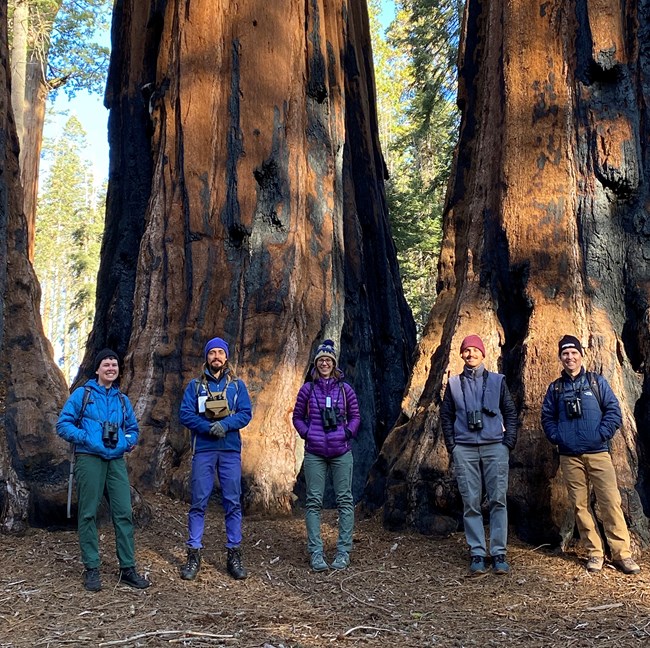
Field staff provide critical support.
Between 2011 and 2019, field technicians detected 166 bird species at 2,048 point count stations in Sierra Nevada Network parks. They detected 134 species during formal counts and 32 additional species during other crew activities. Collecting bird data in the Sierra is not just a walk in the park – it takes excellent birding skills and being comfortable backpacking across rugged terrain to remote areas.
Field technicians must go through three weeks of training in bird identification and safe practices for working in wilderness. They must pass a bird identification exam before they can collect data. Crews backpack or dayhike to survey start points along trails in the large network parks – Yosemite and Sequoia & Kings Canyon. By sunrise, each two-person crew must be at their start point, and each person hikes out to seven transect points and pauses for a set time period to identify birds, sometimes by sight, but much more often by sound.
The data that made this report possible are a testament to the hard work and dedication of those who got up before dawn and carried backpacks and binoculars on miles of trails to reach the monitoring sites by sunrise.
Modeling helped with data analysis.
Lead author and IBP Research Ecologist Chris Ray used a modeling approach to quantify and account for variables that may affect detection of birds in the field, as well as to examine geographic or climate effects that may influence bird abundance. Dr. Ray developed the following sub-models to assess the effects of these different types of variables:
- Distance-mediated Detection: This model includes factors that may affect how likely it is that nearby birds are detected by the observer ̶ noise during the survey (like flowing water), vegetative cover density, and random effect of observer.
- Abundance: These factors are expected to influence bird abundance ̶ station location; year, elevation, and park and interactions among these three; and effects of climate (precipitation-as-snow and mean spring temperature anomalies).
She assessed data at the park-level and at the multi-park level for the large parks with the same sampling design (Yosemite and Sequoia & Kings Canyon). Out of the 166 species detected, 62 were detected frequently enough to support estimates of detection probability and trend. A total of 66 species were detected more than 100 times – Figure 1 illustrates the total number of detections by species and park.

The Institute for Bird Populations (Ray et al. 2022)
What did we learn?
Park-level
In general, bird populations were relatively stable during this time period, but numerous species exhibited either increasing (positive) or decreasing (negative) population trends. Different patterns of population trends (measured as density, or numbers of birds per hectare) emerged related to park. The total number of model-supported trends was similar between Sequoia and Kings Canyon (SEKI) and Yosemite (YOSE), but the general direction of trends contrasted between parks – 91 percent of trends were positive for Yosemite while only 26 percent were positive for Sequoia and Kings Canyon (Figure 2). Devils Postpile National Monument (DEPO) had more positive than negative trends:
- SEKI – 23 trends (6 positive and 17 negative)
- YOSE – 22 trends (20 positive and 2 negative)
- DEPO – 5 trends (4 positive and 1 negative)


The Institute for Bird Populations, Ray et al. 2022
Common and Differing Trends among Parks
Sequoia & Kings Canyon and Yosemite
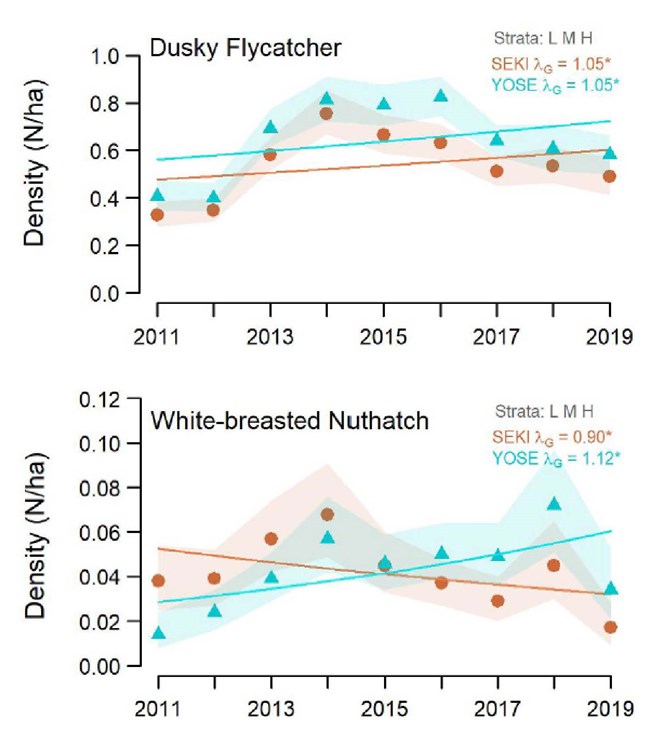
Many species showed stable population trends, but a variety of species had increasing or decreasing population trends during this time period. Increasing population trends occurred for Dusky Flycatcher and House Wren in all network parks, and for Red-breasted Nuthatch, Dark-eyed Junco, Lazuli Bunting, and Green-tailed Towhee in both SEKI and YOSE. Decreasing population trends occurred for Western Wood-Pewee and Pine Siskin for both SEKI and YOSE. Three species―White-breasted Nuthatch, Hermit Thrush, and Hermit Warbler―declined in SEKI but increased in YOSE.
Figure 3 illustrates examples of species with similar trends in density between SEKI and YOSE as well as with opposite trends. Similar graphs are available for all bird species with large enough sample sizes to permit trend estimation (Ray et al. 2022).

The Institute for Bird Populations, Ray et al. 2022
Devils Postpile
In Devils Postpile National Monument, one species decreased in density between 2011 and 2019: the MacGillivray's Warbler density fell to less than half its estimate for 2011 (Figure 4). However, densities for Dusky Flycatcher, Steller's Jay, House Wren, American Robin, and Green-tailed Towhee all rose during this period.
Large Scale: Sequoia & Kings Canyon + Yosemite
At the spatial scale of the large parks together, more species increased in density (14 species) than decreased (10 species) – see Table 1. Trends appearing at the larger scale were often not evident at individual parks. For example, while 14 species increased in density at the larger scale, only five of these increased across both SEKI and YOSE in the park-level analysis: Dusky Flycatcher, Red-breasted Nuthatch, House Wren, Dark-eyed Junco, and Lazuli Bunting.
| Bird Species | Both Parks | SEKI | YOSE |
|---|---|---|---|
| Mountain Quail | ↑ | – | ↑ |
| Red-breasted Sapsucker | ↓ | ↓ | – |
| Hairy Woodpecker | ↑ | – | ↑ |
| Western Wood-Pewee | ↓ | ↓ | ↓ |
| Dusky Flycatcher | ↑ | ↑ | ↑ |
| Cassin's Vireo | ↑ | – | ↑ |
| Steller's Jay | ↓ | ↓ | – |
| Wrentit | ↓ | ↓ | – |
| Red-breasted Nuthatch | ↑ | ↑ | ↑ |
| House Wren | ↑ | ↑ | ↑ |
| Townsend's Solitaire | ↑ | – | ↑ |
| American Robin | ↑ | – | ↑ |
| Gray-crowned Rosy Finch | ↓ | ↓ | – |
| Purple Finch | ↓ | ↓ | – |
| Cassin's Finch | ↑ | – | ↑ |
| Pine Siskin | ↓ | ↓ | ↓ |
| Dark-eyed Junco | ↑ | ↑ | ↑ |
| Fox Sparrow | ↓ | ↓ | – |
| Lincoln's Sparrow | ↑ | – | ↑ |
| Green-tailed Towhee | ↑ | – | ↑ |
| Spotted Towhee | ↓ | ↓ | – |
| Orange-crowned Warbler | ↓ | – | – |
| Black-throated Gray Warbler | ↑ | – | ↑ |
| Lazuli Bunting | ↑ | ↑ | ↑ |

Doug Greenberg, Flickr, CC-BY-2.0.
What factors are related to patterns in bird abundance?
Warmer, drier conditions had benefits for many populations.
Most populations of birds varied directly with spring temperature the previous year, when nests that produced many of the current-year birds would have been active – warmer temperatures were associated with increases in bird densities. Half of the populations varied inversely with precipitation-as-snow – years with more snow were associated with decreases in bird densities. Reduced snow cover and milder spring conditions associated with recent warming and drought may thus have played an important role in the recent, perhaps ephemeral stability of birds in SIEN parks.
Prolonged warm, dry conditions may have negative effects.
If the depth and duration of snow cover continue to decline, negative impacts of drought on vegetation condition and breeding habitat quality could eventually lead to negative effects on bird abundance. Sequoia and Kings Canyon National Parks experienced hotter and drier overall conditions than the northernmost parks and had more negative trends in bird densities and fewer positive trends. Further research is underway to better understand impacts of warming temperatures and drought on bird populations.

NPS / Tony Caprio
Detecting Change – Monitoring Works!
Tracking changes in multiple species across the varied habitats of our network parks is inherently challenging – from field data collection to the complex analytical methods used to identify and understand patterns. If the annual number of point counts were too low, year-to-year variation in bird abundance could be high enough to mask trends over time. But trends were detectable for many bird species in these parks. These results tell us that our methods are effective at detecting trends in bird populations – and that change is occurring. We will be watching to see what additional years of monitoring and analysis tell us about longer term trends in these populations. Warming temperatures, hotter droughts, and severe wildfires have killed many trees and altered habitat in Sierra Nevada parks and surrounding lands. Monitoring gives us one approach for assessing bird populations.
References
Ray, C., R. L. Wilkerson, R. B. Siegel, M. L. Holmgren, and S. A. Haultain. 2022. Landbird population trends in parks of the Sierra Nevada Network: 2011–2019 synthesis. Natural Resource Report NPS/SIEN/NRR—2022/2402. National Park Service, Fort Collins, Colorado. https://doi.org/10.36967/nrr-2293643.
Siegel, R. B. and R. L. Wilkerson. 2022. A Giant Loss: Losing sequoias could be a blow to Sierra Nevada birds. The Wildlife Professional 16(3): 54-55.
Tags
- devils postpile national monument
- sequoia & kings canyon national parks
- yosemite national park
- birds
- landbirds
- monitoring
- devils postpile national monument
- sequoia and kings canyon national parks
- yosemite national park
- bird monitoring
- sien
- sierra nevada network
- climate
- climate change effects
- climate change impacts
