Last updated: March 25, 2023
Article
Putting It in Perspective: How do the 2023 high river flows compare to recent past events?

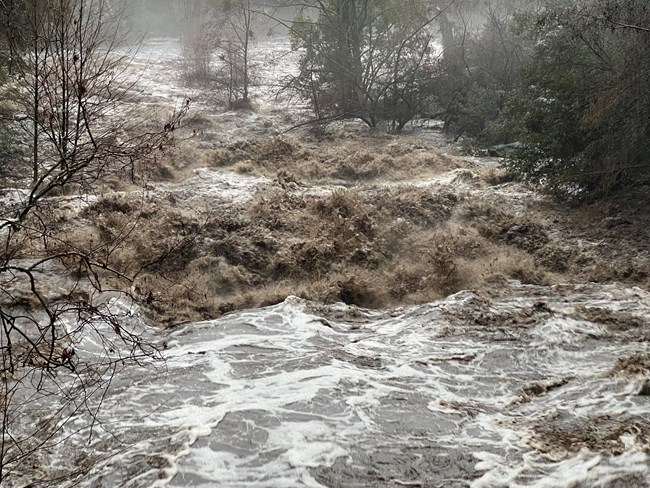
NPS / Dave Fox
Recent years of severe drought in California have focused attention on water scarcity and wildfire-related hazards and impacts. But the state also has a history of megafloods, and climate change is increasing the odds of a high-magnitude flood event happening in our lifetimes. While a long way from megaflood scale, we can compare the winter 2022-2023 high precipitation and river flows to similar past events. Large wildfires that burned vegetation on slopes above roads and trails in 2020 and 2021 increased the likelihood that rockfalls and debris transport would damage infrastructure during and following major storms. Gaining a longer timeframe perspective helps park managers prepare for combined water and fire-associated hazards in the coming months and years.
Watching the River Flow
Park Ecologist Erik Meyer compared river peak flow rates at a Three Rivers, California river gage that has recorded hourly and daily flow since May 2007. He examined all of the peak hourly measurements, matching them to weather records from the National Oceanic and Atmospheric Administration (NOAA) and comparing them to a written history of local area floods (Austin 2015). He found that the 2023 January 9, March 10, and March 15 peak hourly and mean daily flows were the highest in the past 14 years at the Three Rivers gage (see Table 1 and Figure 1). However, each of these three 2023 high flows were lower than the 1997 peak hourly flow that reached 56,595 cubic feet per second (cfs) at a downstream gage where the river enters the Lake Kaweah reservoir. Rain falling on snowpack contributed large amounts of snowmelt water to rivers and streams during seven out of nine of these high flow events.
| Date | Flow (cfs) – Three Rivers, CA (TRR) gage |
Flow (cfs) – Lake Kaweah inflow (TRM) gage |
Event |
|---|---|---|---|
| 1/2/1997 | NA | 56,595* | Rain on snow, atmospheric river |
| 3/10/2023 | 26,658 | 42,660 | Rain on snow, atmospheric river |
| 11/8/2002 | NA | 30,273 | Atmospheric river |
| 1/9/2023 | 22,973 | 27,049 | Rain on snow, atmospheric river |
| 3/15/2023 | 22,736 | 31,264 | Rain on snow, atmospheric river |
| 10/14/2009 | 20,937 | Rain on snow, atmospheric river | |
| 2/7/2017 | 18,550 | Rain on snow; huge snowpack >150% April 1 average** | |
| 1/9/2017 | 16,856 | Rain on snow; huge snowpack >150% April 1 average** | |
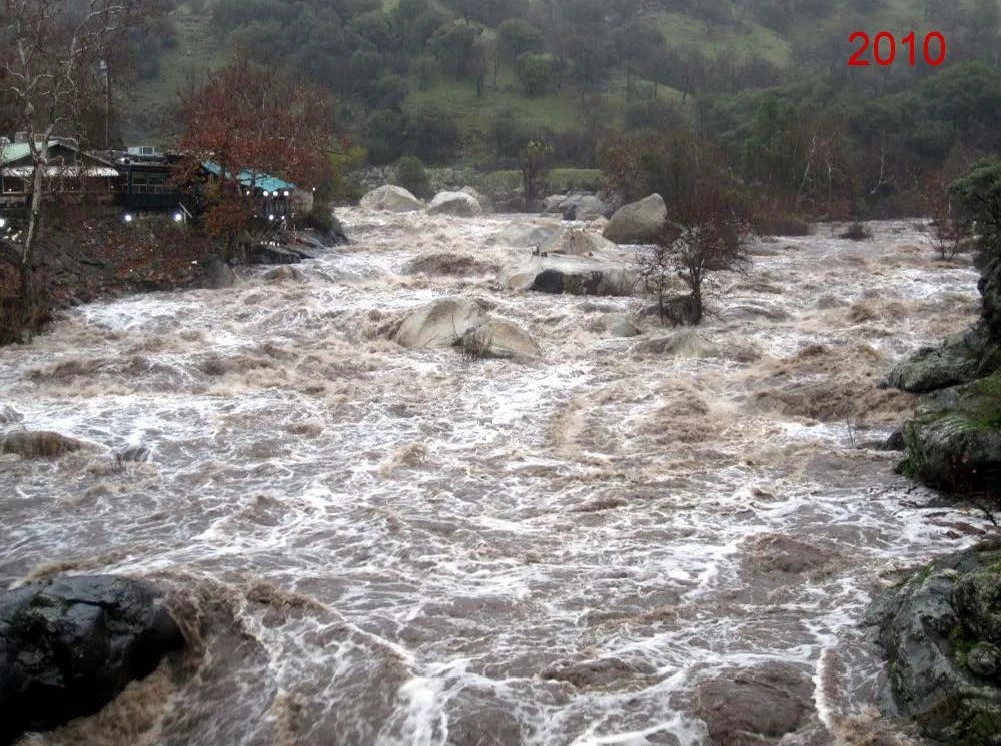
| 12/19/2010 | 15,831 | Driven by 8.5 inches of rain in Three Rivers, Dec 17-20** |

NPS / Erik Meyer
What conditions led to these high-flow events?
Atmospheric rivers drove at least six of these high-flow events – January 2, 1997; January 9, March 10, and March 15, 2023; October 14, 2009; and November 9, 2002, and likely contributed to the remaining three as well. Atmospheric rivers are long ribbons of moisture that transport huge amounts of water vapor from the tropics toward the poles. When atmospheric rivers move inland and strike mountains, the air rises and cools, creating heavy rainfall. Atmospheric rivers are the source of nearly half of California’s precipitation, and they cause a large majority of the region's major floods.
Rain falling on snowpack and subsequent snowmelt can contribute meltwater from large higher elevation drainage basins. Rain-on-snow contributed to seven out of nine of the high flow events noted in Table 1. During the warmest storms, the effective area of these drainage basins can become several times larger than during more typical winter storms. An atmospheric river may transport moisture from the tropics (noted unofficially as a “pineapple express”). Also, as winter temperatures increase with warming, rain falls at higher elevations, contributing a higher volume of meltwater to downslope streams and rivers. Depending on the intensity of the rain and the depth of the snow, the lag time when rain starts falling on snow and begins to melt enough water to flow out of the snowpack can be just a matter of hours.

Combined Impacts of Sequential Extreme Events
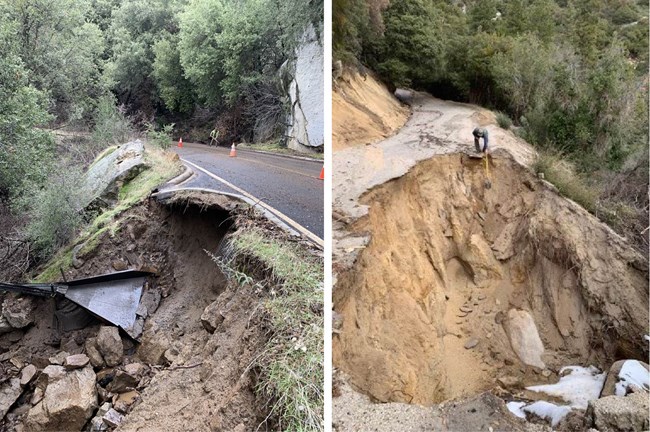
When major storms follow large, high-severity fires, especially in mountainous terrain, impacts to landscapes and infrastructure can be compounded by debris flows, rockfalls, and fallen trees. Slopes burned in high-severity fires lack the vegetation cover that helps stabilize soil and rocks. When hit by high-intensity, long-duration storms, exposed soil and rocks as well as fallen trees can damage roads. Culverts that drain normal runoff from slopes during storms can quickly become filled and inoperative when runoff carries rocks, soil, and other debris down slopes. Then water can flow over or erode its way under roadways, compromising their integrity. This tends to lengthen the time needed to assess and repair roads, resulting in longer road closures.
Six Kaweah River High Flow Events in Photos
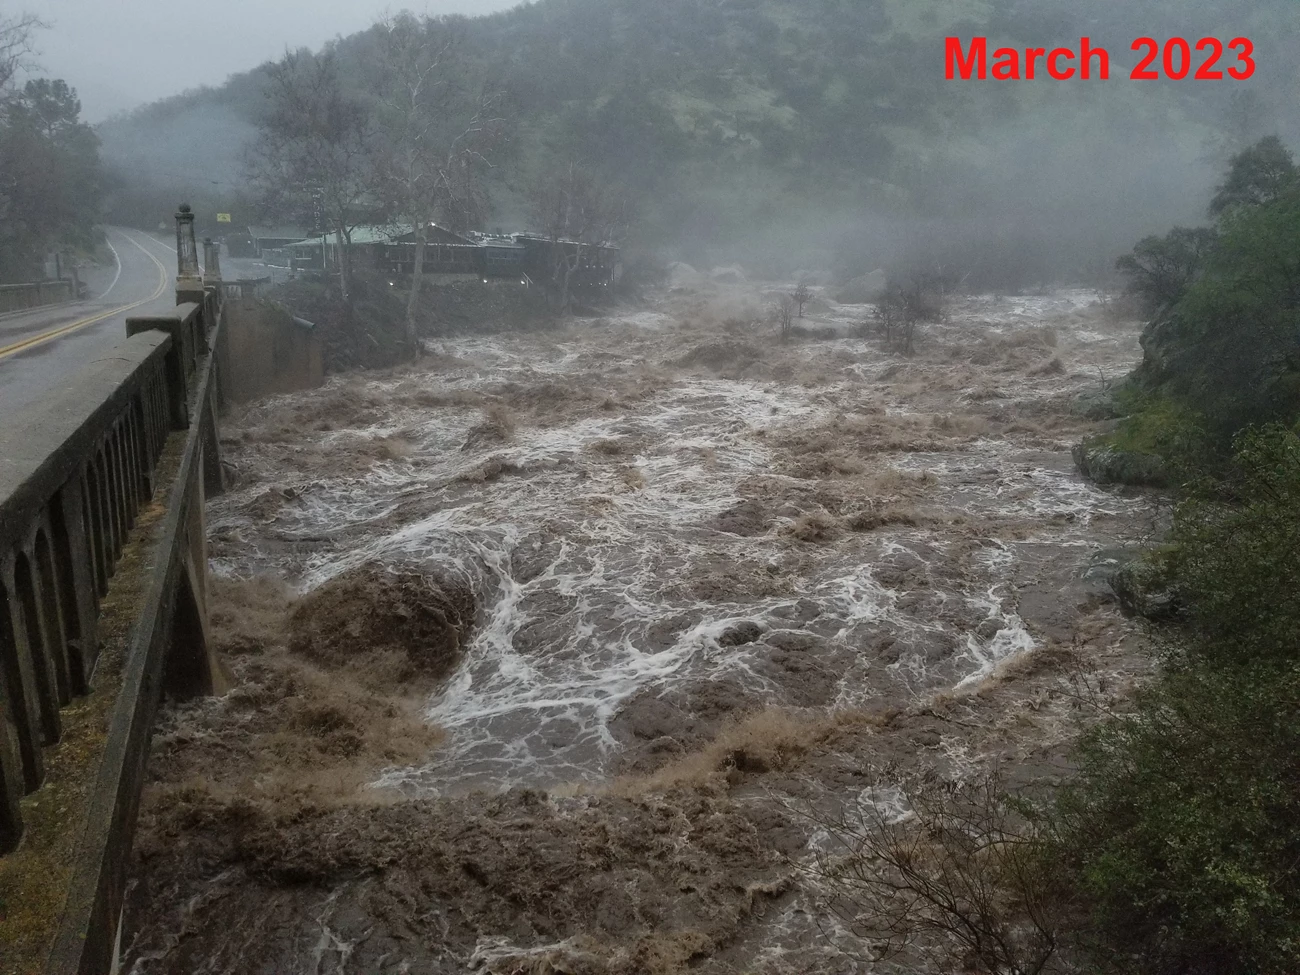
While the following photos may not show the actual peak flows, they were taken on the dates peak flows were recorded. The photo location is the Main Fork of the Kaweah River from a bridge just outside the Sequoia National Park main entrance station. The first photo shows a more typical flow, occurring on March 8, 2023, prior to the March 10 storm.

NPS / Tony Caprio

NPS / Tony Caprio

NPS / Tony Caprio

NPS / Tony Caprio

NPS / Tony Caprio

Tony Caprio
What happened in the past, and what can we expect for the future?
While the high-flow events described above are impressive, there were numerous higher-flow/flooding events in earlier years, and we can expect a greater probability of large storm events and floods in the future. One particular past event, the 1861-1862 megaflood, is widely considered as a benchmark for a “plausible worst case scenario” flood in today’s California. This flood inundated large areas of California, including an approximately 300-mile long stretch of the Central Valley, large portions of the Los Angeles metro area, and virtually every narrow river valley throughout the state. Modeling of a similar-scale event in modern-day California would result in widespread, catastrophic flooding throughout the state, causing greater damage, disruption, and economic losses than a large-magnitude earthquake near a major urban area.
Recent research and modeling have predicted changes in snowfall patterns due to warming temperatures and increased freezing levels. At lower to mid elevations (4,000 – 6,500 feet) precipitation is likely to shift from snow to rain, but would remain primarily snow at above 7,000 feet. While snow disappears at the lower elevations, it is expected to have large increases in accumulation above 7,000 feet. So, it is anticipated that more precipitation will fall as rain due to warming temperatures – leading to instantaneous runoff as opposed to the accumulation of snow that would melt gradually over time. In addition, there is evidence more rain-on-snow events will occur, further increasing the runoff burden on rivers and streams, and thus flood risk. In these parks, we can use our data and experiences from recent and past fire and storm events combined with predicted events to help us prepare for increasing hazards.
References and More Information:
Austin, J.T. 2015. Floods and Droughts in the Tulare Lake Basin, 2nd edition. Sequoia Parks Conservancy, Three Rivers, California
Kattelman, R. 1997. Flooding from rain-on-snow events in the Sierra Nevada. Destructive Water: Water-caused Natural Disasters, their Abatement and Control (Proceedings of Conference, Anaheim, California, June 1996) IAHS Publ. no. 239.
National Oceanic and Atmospheric Administration (NOAA). What are atmospheric rivers? https://www.noaa.gov/stories/what-are-atmospheric-rivers. Web page: Accessed 2 February 2023.
Swain, D. 2022. ARKStorm 2.0: Climate change is increasing the risk of a California megaflood. Research Summary, Weather West Blog.
Summary by Linda Mutch and Erik Meyer, February 2023.
