Last updated: May 1, 2024
Article
Wadeable Stream Monitoring at Chattahoochee River National Recreation Area

NPS photo / Mark Hynds

NPS photo / Mark Hynds
I’m not a scientist. But several weeks ago, I tagged along with a group of scientists to survey a stream in the Chattahoochee River National Recreation Area. Studying wadeable stream habitats is part of the National Park Service’s Inventory and Monitoring Division’s effort to evaluate the condition of park’s natural resources. I toil at my desk editing reports derived from data collected during these surveys, so I jumped at the opportunity to see those pages come to life in a park.
Chattahoochee River National Recreation Area is thousands of acres of pine and hardwood forests mixed with wetlands, buffering a 48-mile stretch of the Chattahoochee River, from the Buford Dam at Lake Lanier, down to the city of Atlanta. Hydropower releases from Buford Dam and runoff from these developed areas strongly influence the flow of that main channel and its tributaries. Development and the associated impervious surfaces like roofs, streets, and parking lots can change the quality, timing and duration of water entering streams. In other words, streams generally become more “flashy” with higher quicker pulses of water during storm events and lower flows during dry periods. Higher peak flow and changing water quality can affect the stability of the surrounding banks and vegetation. When stream banks erode and move laterally, it can affect infrastructure like parking lots and bridges and create trouble for the plants and animals that call these streams home.
A natural and stable stream exists in a relatively balanced state where sediment supply is roughly equal to export by stream flow. When this balance is upset by too much or too little sediment it may alter the aquatic habitats and species that depend on them. Excessive sediment in a stream can smother the habitats of aquatic communities. Human disturbances such as littering or heavy usage of bike and foot trails, can also have adverse effects. Stream surveys are conducted every few years to see how conditions have changed and the potential impact those changes have on the aquatic ecosystem.
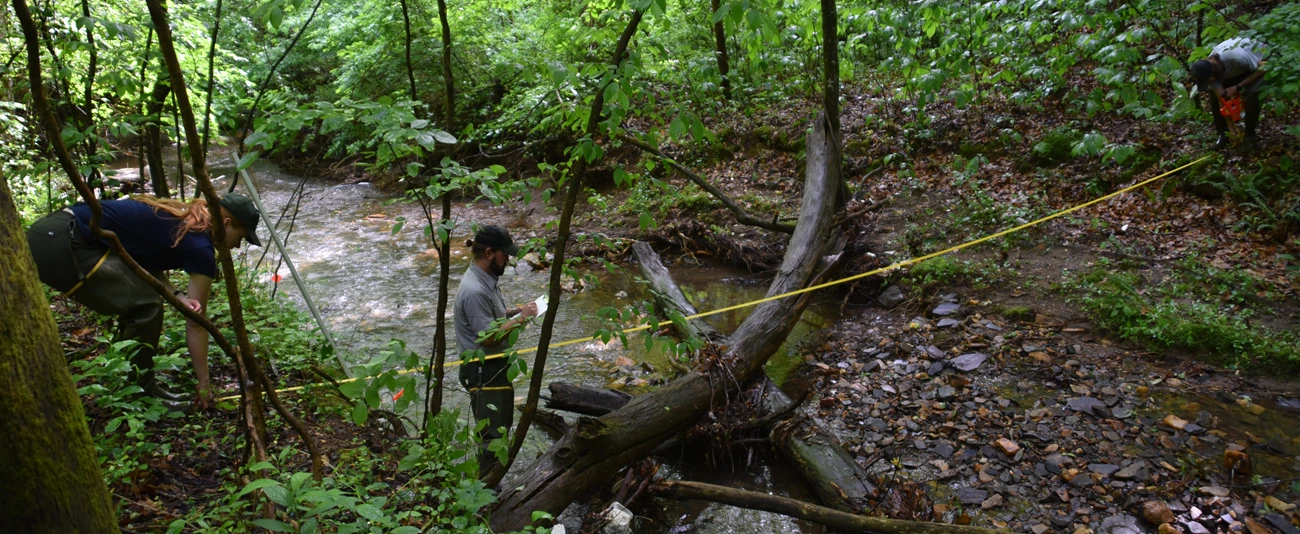
We met in the parking lot for the Cochran Shoals unit of the park. Wadeable streams can be accessed without needing a boat, which was the only thing the team didn’t carry into the woods. They lugged backpacks, laptops, tripods, measuring rods and survey tape down a wide and thankfully flat, hiking trail to the site. Rain threatened to fall the entire morning except for the occasional snapshot of sunshine through the thick, shelter of trees. The survey site, on Gunby Creek, was just steps away from the trail and that proximity was a factor when this stream was chosen for monitoring.
It was the team’s second week at the park, so unpacking and setting up equipment went quickly. The original plan was to complete all the park sites in a week, but consistent, heavy rains dampened those plans. The surveys need low-flow conditions, so the swollen streams created a few idle days. This was my second attempt to join the crew. The first visit ended with a rain-soaked dash to the car past an audience of Canada geese in a deserted parking lot under the shadow of Buford Dam.
Consistency is important in long-term monitoring, so each survey site has permanent benchmarks, installed by the network, in the ground at the farthest point upstream, downstream, and in the middle on either side. Each site consists of 11 transects or imaginary perpendicular lines across the stream, an equal distance apart. Locating the benchmarks and flagging them was the first task.
Data collection started with overall stream characterization, or the big picture. Using a mirror like device called a densiometer, SECN Physical Scientist Stephen Cooper measured canopy cover, the trees overhead, getting readings upstream, downstream, and on the left and right bank. He also estimated the type of habitat or geomorphic channel units or GCUs, calling out the percentages like numbers in a Bingo game. A run is slow moving and shallow, a riffle flows swiftly over submerged or partially submerged obstructions, typically rocks. A pool is, like an actual pool. Pools and riffles were the most common at this site. Multitasking, Stephen also took bearings from one transect to the next with a survey compass and snapped four directional photos of each transect which will be included in the data report. A pebble count was also taken to assess the stream bed material. Standing in a riffle representative of the entire stream reach, 100 particles are randomly selected and measured. This somewhat tedious task tells managers important information about the characteristics of the stream that can influence.
Fallen trees and branches, also known large woody debris, can alter the flow of water and sediment in the stream as well as influence the geomorphic channel units. Pieces of wood needed to be greater than 10 centimeters or 3.9 inches in diameter and at least 1 meter or 3.3 feet in length to be recorded. The largest piece found was just over 7 meters in length. The most common types of wood found in this stream were in jams (think dams) and a ramp (leaning against the bank), which can trap sediment, potentially altering habitats for fish and bugs.
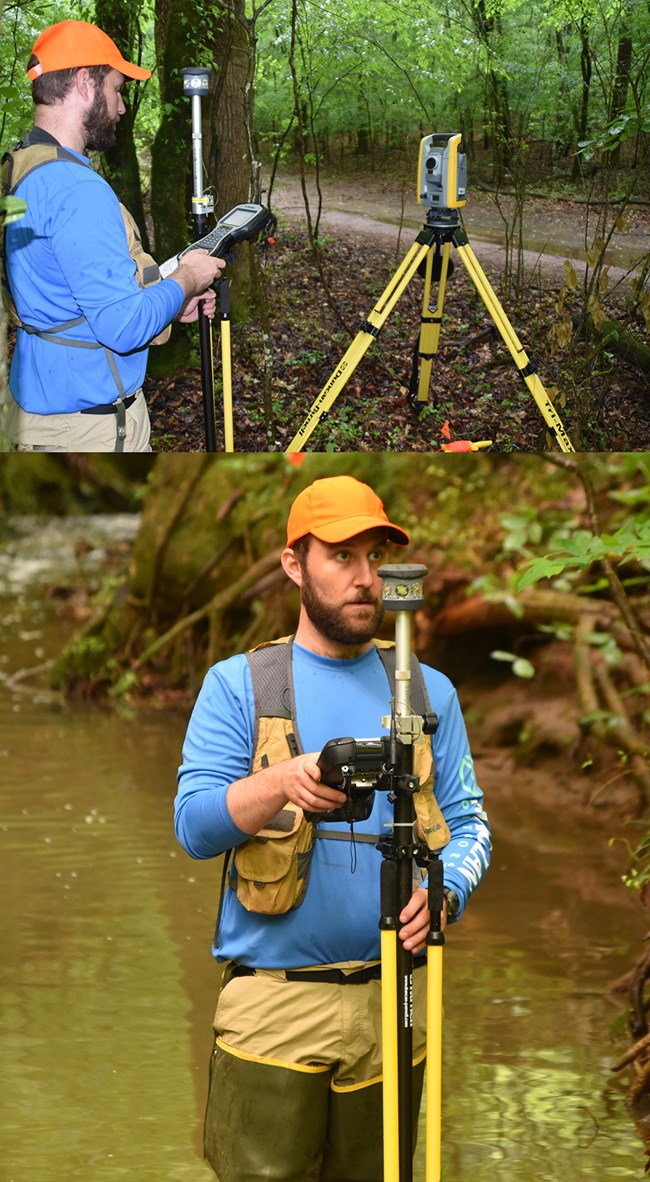
After collecting data on the overall condition of the survey site, diving deeper into each transect was next. Physical measurements using the survey tape, stadia rod, and good balance were taken at each of the 11 transects. At three of them, designated as detailed transects, additional analysis was completed using a Trimble S6 robotic total station, which electronically calculate angles and distances, just like a land surveyor would use.
The protocol’s lead author and assistant professor at the University of North Georgia, Dr. Jacob Bateman-McDonald, operated the total station, taking a series of cross-sectional measurements at each detailed transect. Positioning the total station over a benchmark, he carried the Trimble TSC3 handheld data collector to each point along a line perpendicular to the stream’s flow. Starting outside the benchmark, he moved along the line collecting points, down the bank and through the stream, and up and beyond the other bank. From the different survey points various width and height metrics can be calculated (wetted, bank full, channel full, channel area, etc.).
Getting those physical measurements at each transect was a challenging task. Stephen, SECN Hydrological Technician Daniel McCay, and Chattahoochee River NRA intern Louisa Markow, slogged through the stream and clambered up and down the slippery, muddy banks, all while holding the survey tape and keeping the stadia rod steady. It was a lot of crouching, bending, and struggling to maintain footing. Staying dry became an issue as the deep water upstream creeped to the top of their hip waders.
The data form uses terms like bankfull, active channel, wetted width, and thalweg. Essentially, the task is to obtain the dimensions of the stream channel. Widths are measured at four points on the bank. Heights are measured at two points, where the stream completely fills the natural channel and the lowest flat surface above that. Bank angles are also measured including undercuts. These measurements, when compared to previous surveys, show how the stream flow is altering the structure of the surrounding habitat. As they traversed the stream, the team also estimated the prevailing type of bank sediment, the amount of vegetation and ground cover on the bank. Bank erosion, the GCUs, the dominant particle size in the stream bed and any other features like sand bars or islands, were also observed and recorded.
It was nearing the noon hour when the team checked off the site as finished. Completed data forms were collected and securely stored. Data collected will be compared with the survey completed in 2017. Seeing what changed since the last survey will help determine any existing impacts of upstream land use and help predict potential issues in the future. It will also provide insight into the habitat conditions for the plants and animals who live in or along the stream.
After packing up their gear, the team hiked back to the truck for a well-deserved lunch break before heading to the next site. The pesky rain that disrupted the schedule the week before was in retreat, so the team’s version of two-a-days was full speed ahead. I made an appearance at the next site for some additional photos and more education. In the spirit of full disclosure, I left soon after the team got started. on the second site. Desk jockeys like me worry about things like traffic, locked gates, and a gas tank near empty.
Collecting data during field work is the lifeblood of the monitoring program. Today’s results from the stream and individual transects will be incorporated into a data summary report which combines data from the greater watershed and larger segment of the stream. It will tell the story of what is happening in the stream and illustrate how it has changed over time. Are aquatic habitats getting better or worse? Are park structures in jeopardy? Will it diminish the visitor experience? Armed with this information, park management can better protect and preserve these natural resources.

NPS photo / Mark Hynds
